How To Draw A Network Graph?
Updated on 15 Oct, 2024
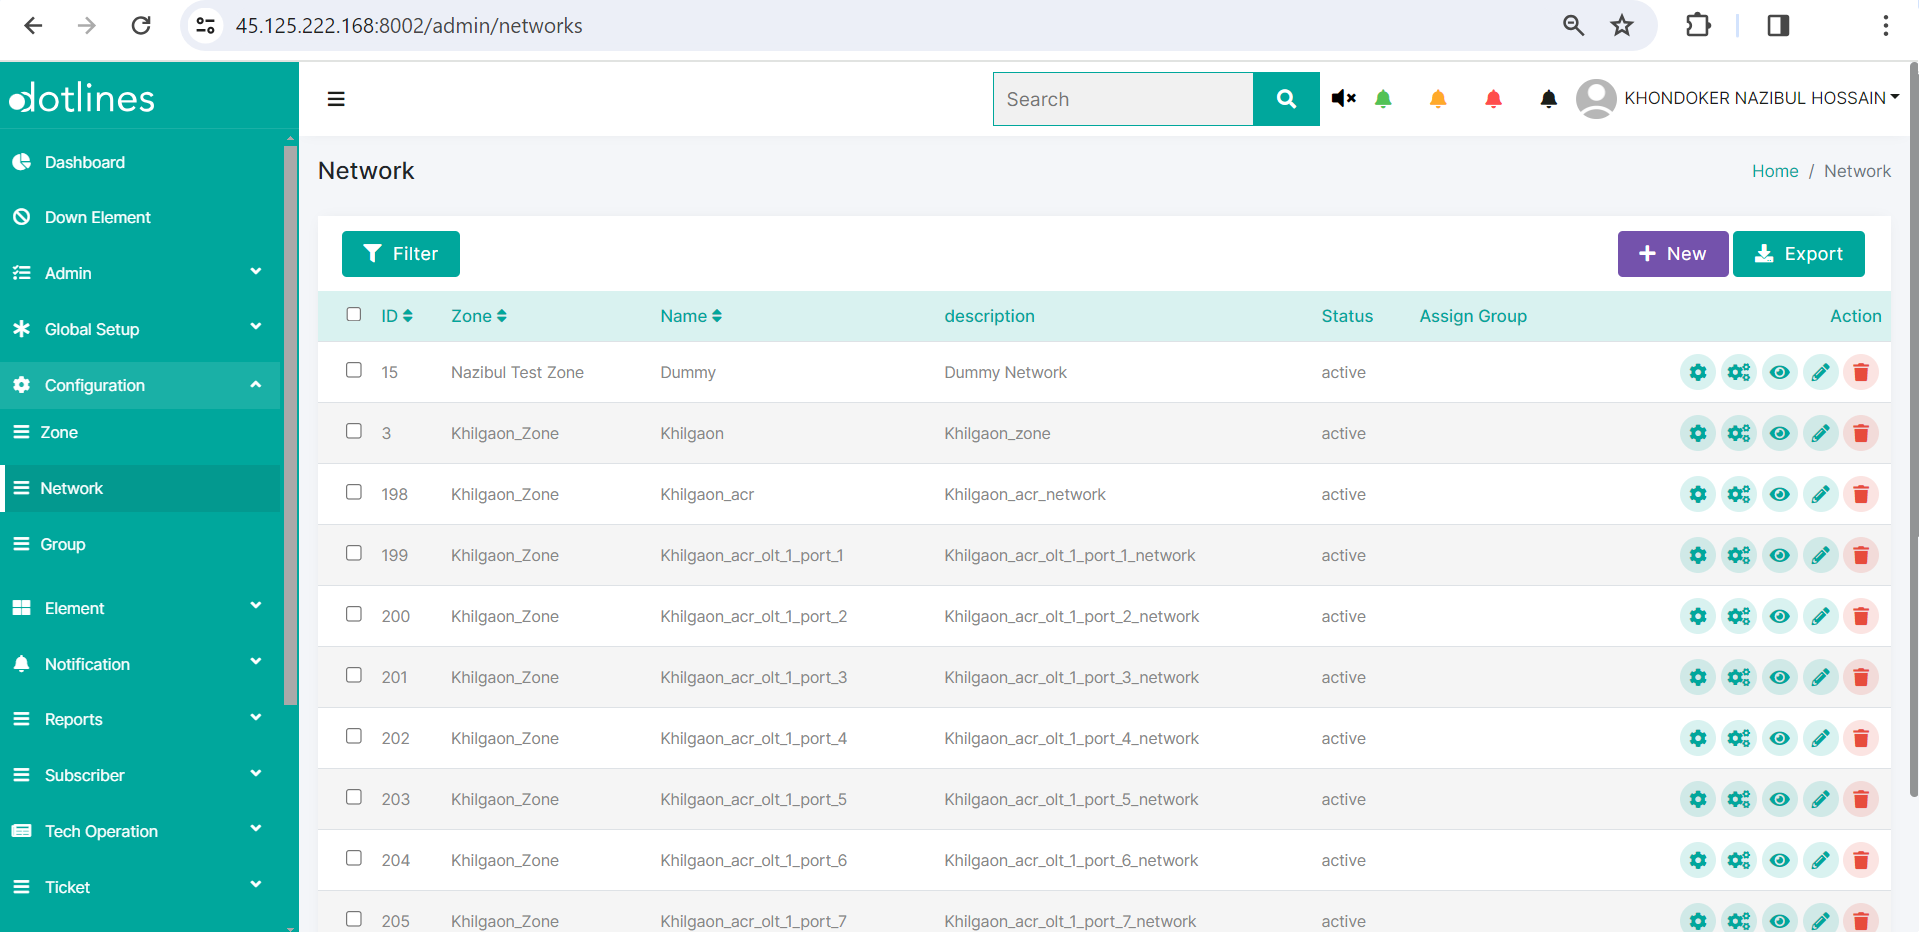
1. Go Configuration> Network
2. A list of network will be displayed, together with their Zone(network zone identifier),Name(network identifier),description,Status(Active/Inactive) and Assign Group(allocated resource). This data can be exported in.csv format if needed.
3. Click Draw Graph![]() to draw the network or, edit the existing network.
to draw the network or, edit the existing network.

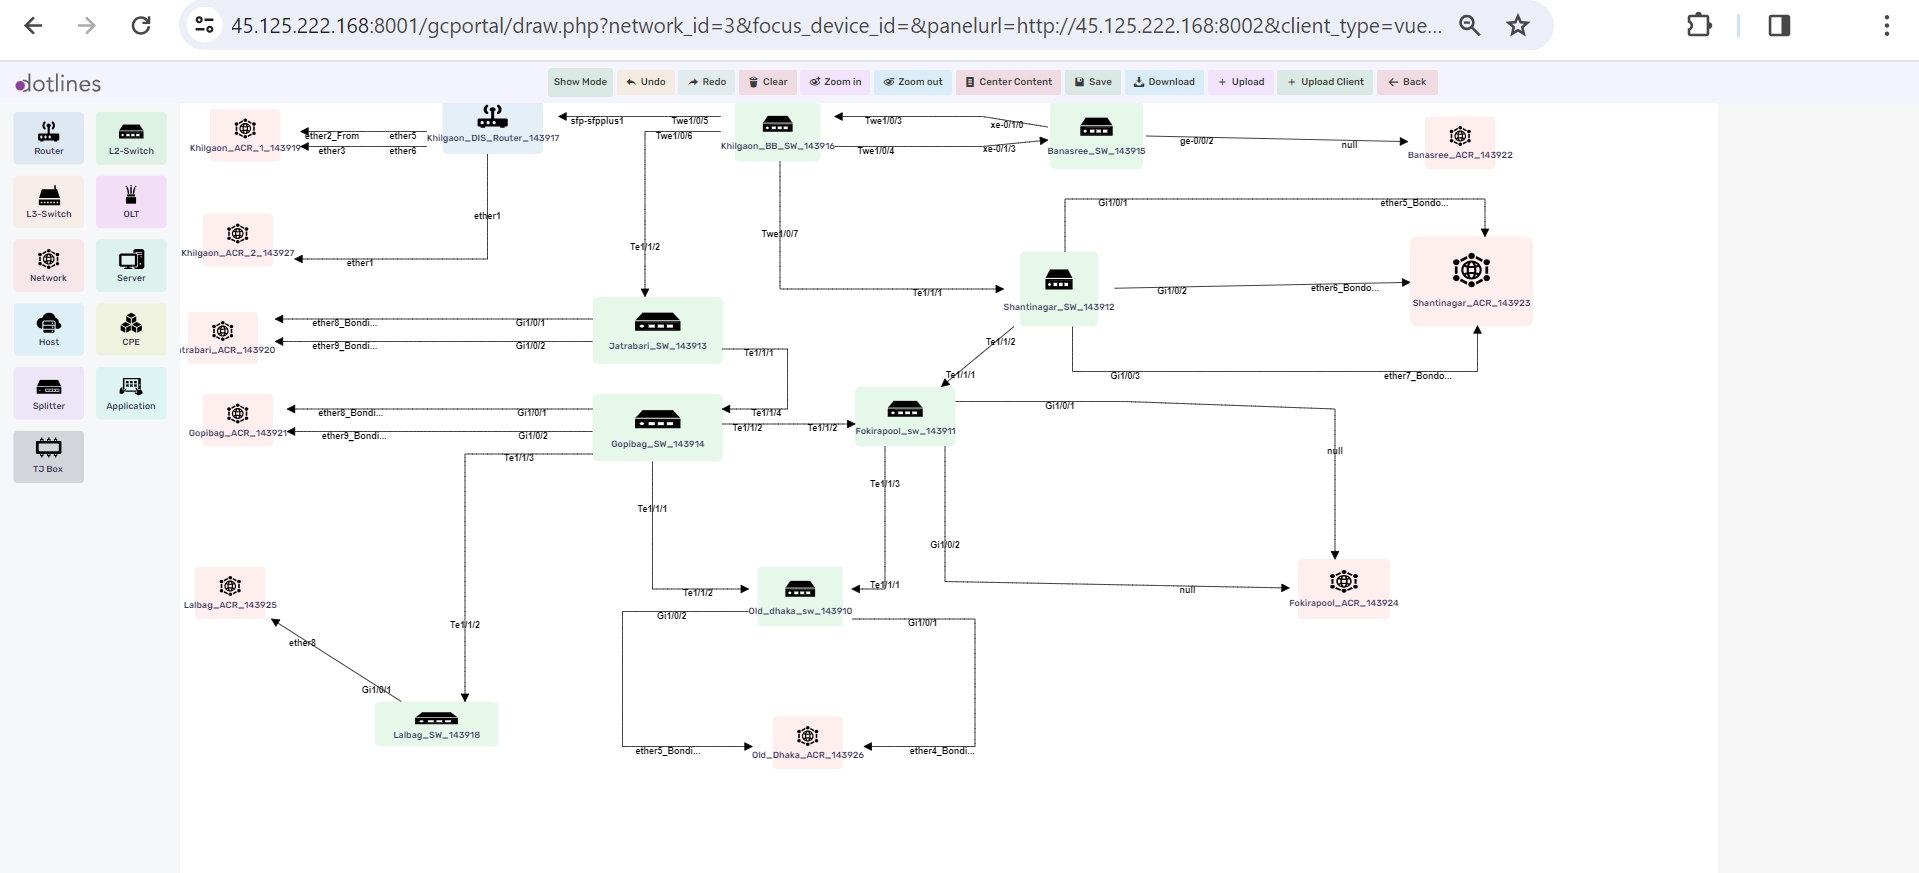
4. A network diagram drawing board will be available. Drag and drop the required item e.g. router, L2-Switch,L3-Switch, Server etc.
5. Each item information may be customized by choosing the item, allowing you to modify the following components in the right panel:
(a) Properties
- Name
- ID (to uniquely identify the item).
(b) Device Information
- Brand name
- Device version
- Device ID
- Installation date
(c) Device Configuration
- Total ports
- Connection type
- Device type
- Command execution templates
- Login delay
- Log types
- IP address
- Port
- Username
- Password
- Remarks
(d) SNMP Configuration
- SNMP version
- Community string
- Port
- Timeout(sec)
- Username
- Password
(e) Monitoring and Scheduling Information
- Monitoring template
- Notification Option (Enabled by checkbox)
- Monitoring start time (in ISO 8601 time format)
- Monitoring end time (in ISO 8601 time format)
- Scheduled restarts Option
- Restart Interval(Day)
- Restart Hour (in ISO 8601 time format)
- All utilization Option
- utilization monitoring methods (SNMP, command, API)
- utilization check intervals (in seconds)
- CPE monitoring Option
- CPE monitor methods (SNMP, command, API)
- CPE check intervals (in seconds)
- Disk monitoring Option
- Disk utilization methods (SNMP, command, API)
- Disk check intervals (in seconds)
- Disk thresholds (to trigger alerts when limits are reached)
- CPU Monitoring Option
- CPU utilization methods (command, SNMP, API)
- CPU check intervals (in seconds)
- CPU thresholds
- RAM Monitoring Option
- RAM utilization methods (command, SNMP, API)
- RAM check intervals (in seconds)
- RAM thresholds
- Session monitoring Option
- Session utilization methods (command, SNMP, API)
- Session check intervals (in seconds)
- Session thresholds
- Environmental monitoring Option
- Environment utilization methods (command, SNMP, API)
- Environment check intervals (in seconds)
- Temperature thresholds
- ICMP monitoring Option
- Echo counts
- ICMP check intervals (in seconds)
- ICMP thresholds
7. Finally, Click Save
Did this article help?