How To Get Last 24 Hour Disk Report?
Updated on 23 Apr, 2024
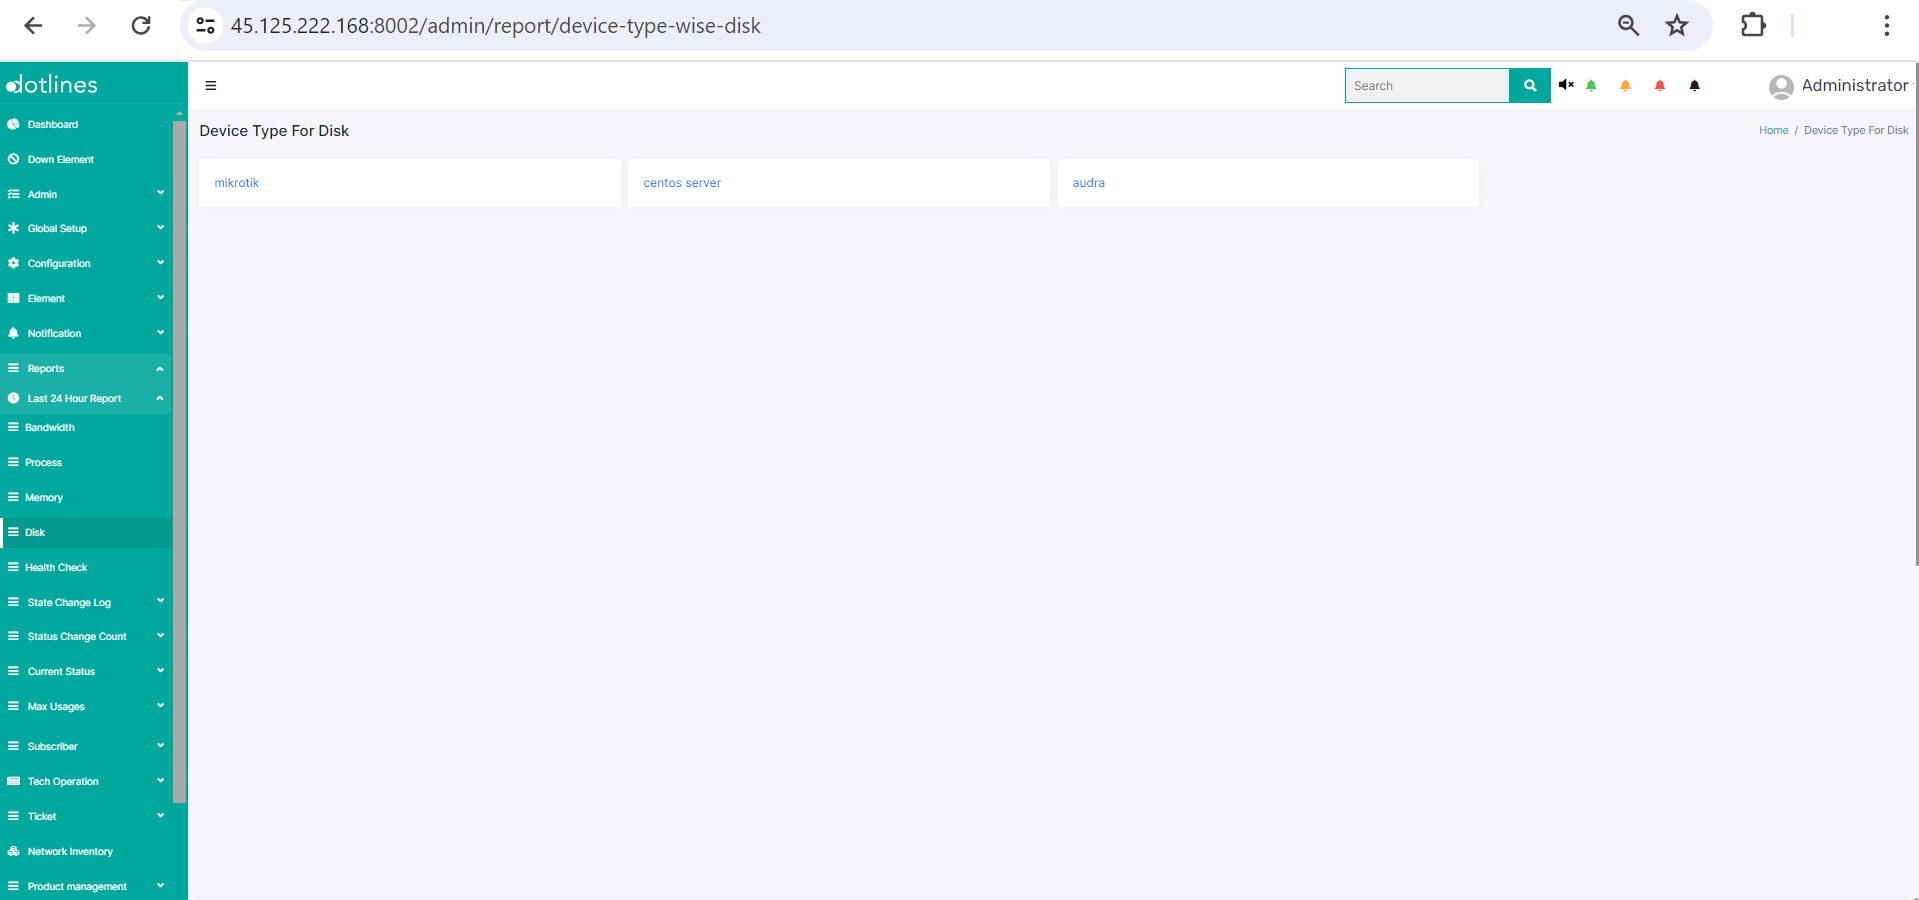
1. Go Reports> Last 24 Hour Report> Disk
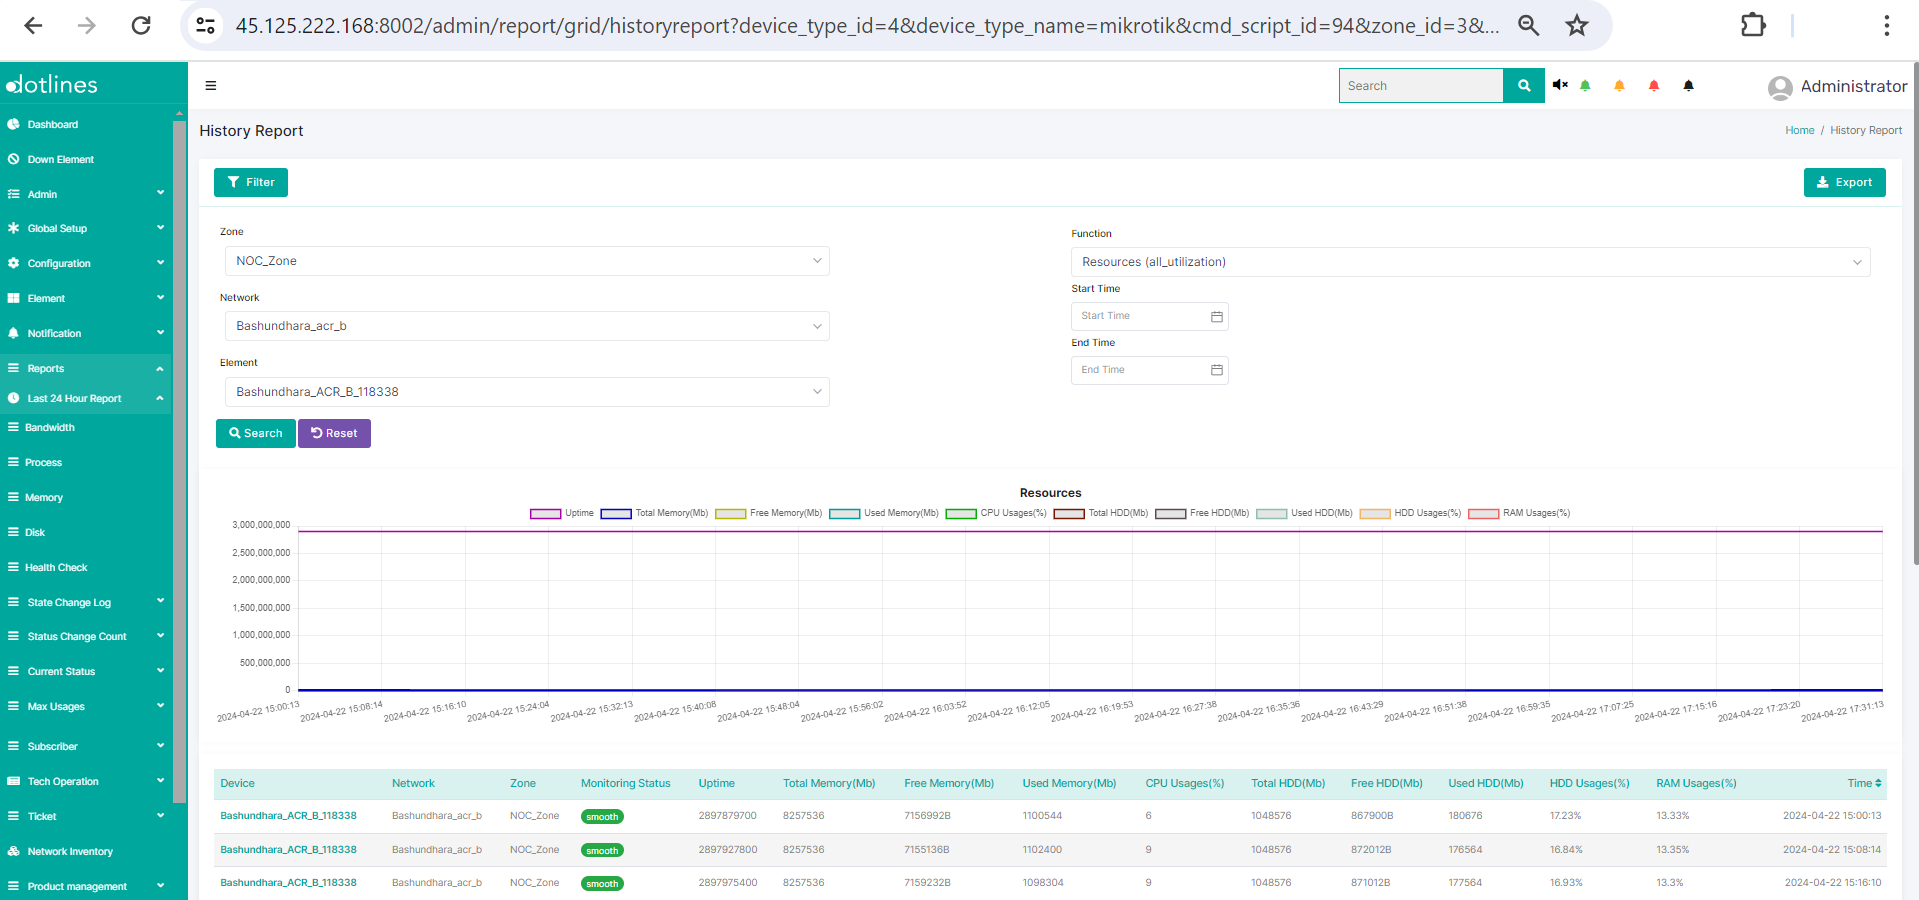
2.A list of device types for disk will be presented. By selecting a certain device type, two styles of representation will be displayed-
a) A line graph of Uptime,Total Memnory(Mb), Free Memnory(Mb),CPU Usage(%), Total HDD(Mb),Free HDD(Mb), Used HDD(Mb), HDD Usages(%) and RAM Usage(%) every 4 minutes.
b) A table containing Device,Network,Zone,Monitoring Status,Uptime,Total Memory(Mb),Free Memory(Mb),Used Memory(Mb),CPU Usages(%),Total HDD(Mb),Free HDD(Mb),Used HDD(Mb),HDD Usages(%),RAM Usages(%) and Time(in date-time format).

Did this article help?