How to Retrieve a Device's Monitoring Data?
Updated on 22 Oct, 2024
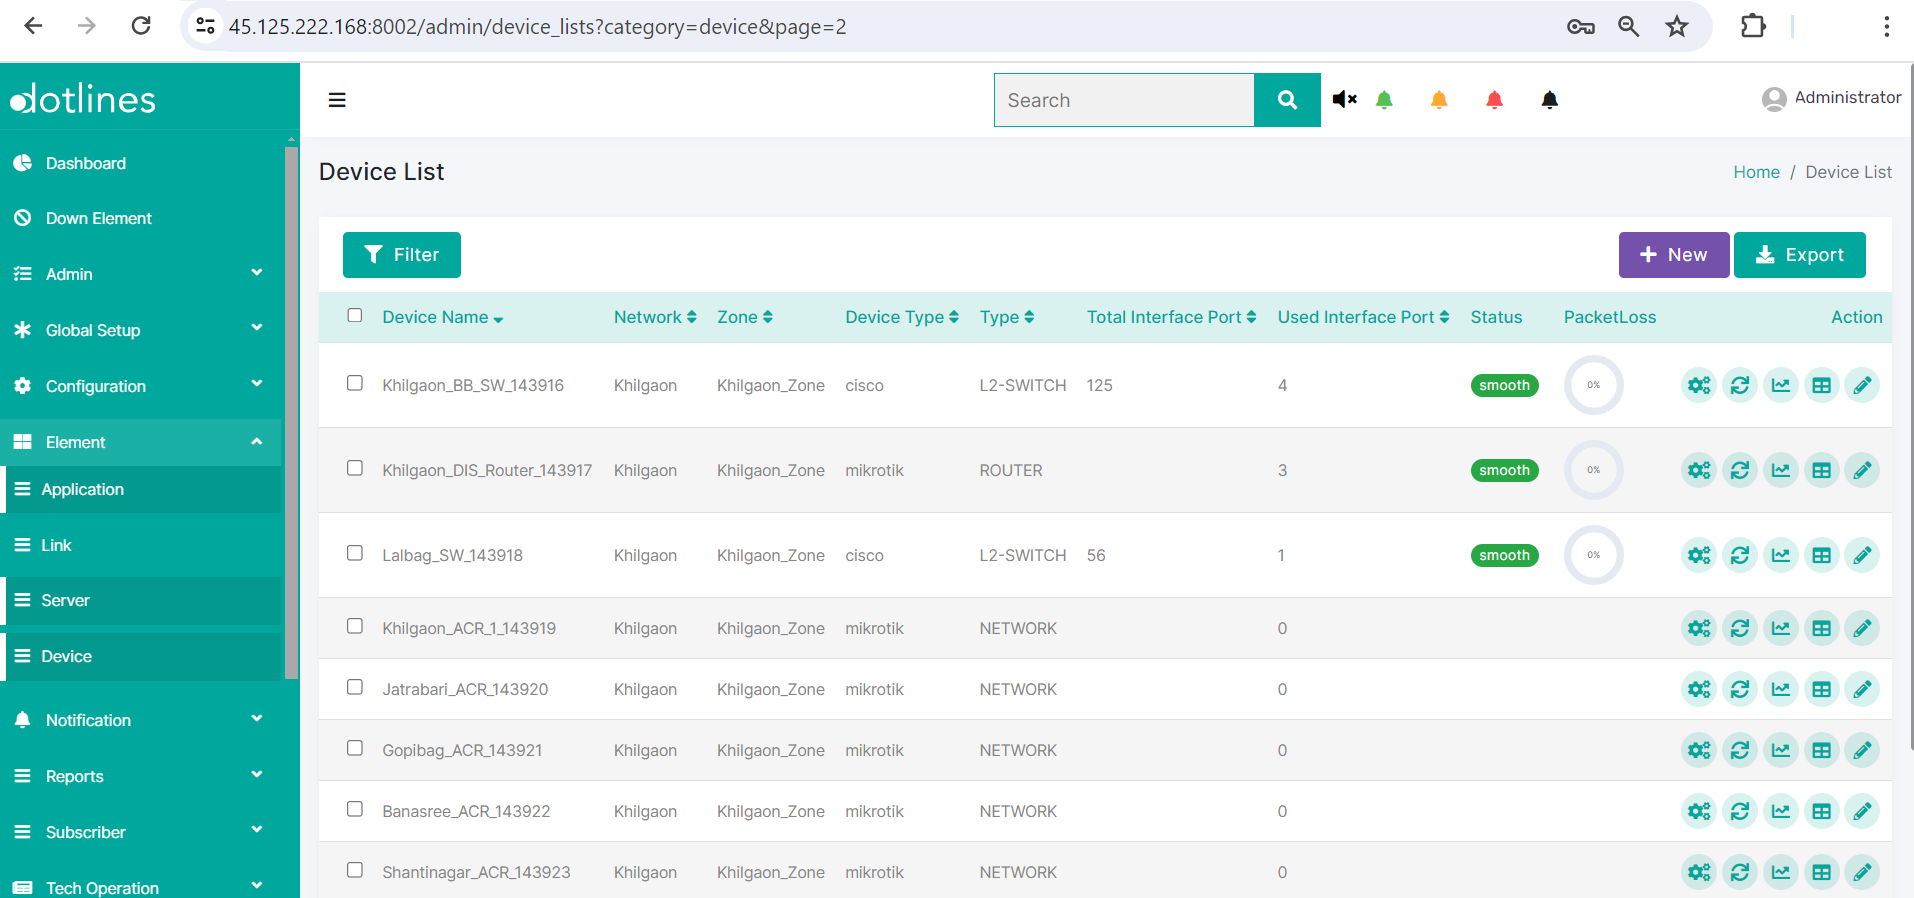
1. Go Element> Device
2. A list of server will be displayed, together with their Device Name(e.g., Khilgaon_BB_SW_143916),Network(e.g., Khilgaon),Zone(e.g., Khilgaon_Zone),Device Type(e.g., cisco),Type(e.g., L2-SWITCH),Total Interface Port,Used Interface Port,Status,Disk(%),Ram(%),CPU(%) and PacketLoss(%). If the status stays alert or down because it exceeds the threshold, the email will be escalated to the relevant group.This data can be exported in.csv format if needed.
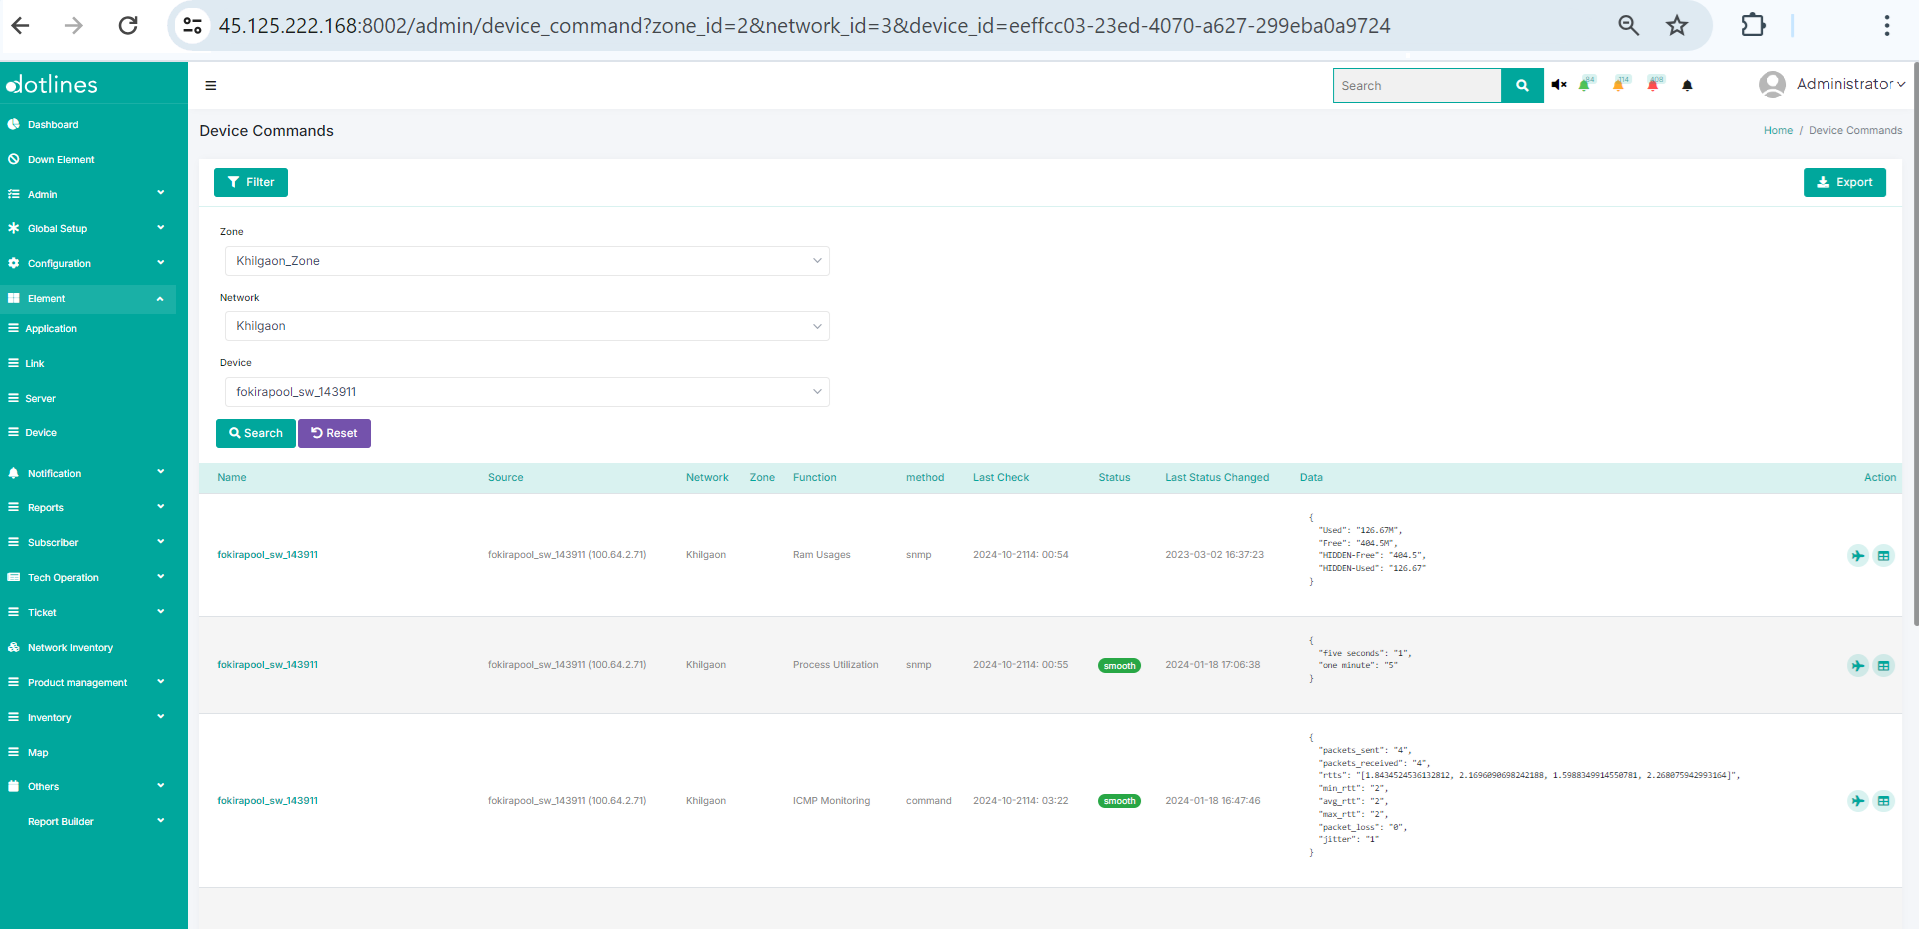
Click Monitoring Data ![]() to get data of a monitoring device with particular monitoring criteria
to get data of a monitoring device with particular monitoring criteria

A list of data consist of Name(device's name), Source(e.g., IP-100.64.2.71), Network Zone(e.g., Khilgaon_Zone), Function(e.g, Ram Usages, Process Utilization), method(e.g., snmp), Last Check(Follows ISO 8601 date-time format), Status(e.g., smooth, down), Last Status Changed(Follows ISO 8601 date-time format) and Data(function wise data e.g., Used: 126.54M, Free: 404.62M, HIDDEN-Free: 404.62, HIDDEN-Used: 126.54).This data can be exported in.csv format if needed.
From this step, there are two choices to drill down:
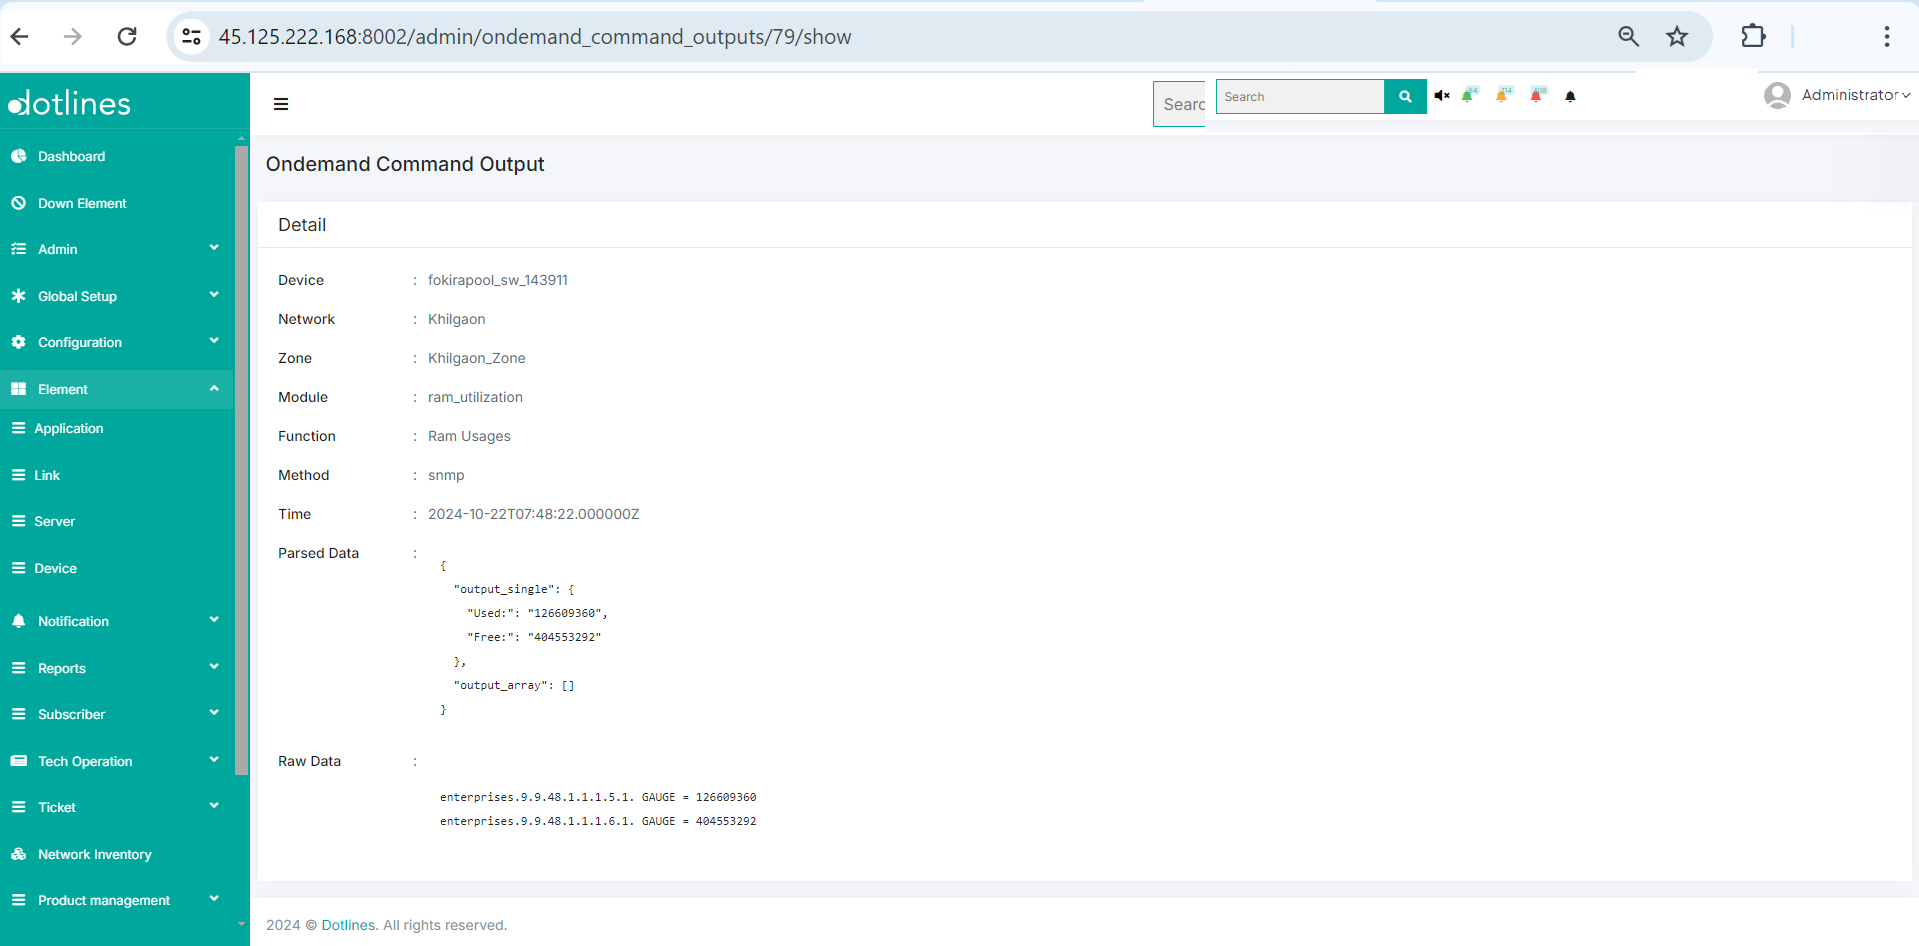
a) Click Instant Data ![]() to get on demand data of a monitoring device with particular monitoring criteria.
to get on demand data of a monitoring device with particular monitoring criteria.

We retrieve the immediate data of the Device, Network, Zone, Module (e.g., ram_utilization), Function (e.g., RAM Usages), Method (snmp), Time (follows ISO 8601 date-time format), Parsed and Raw Data
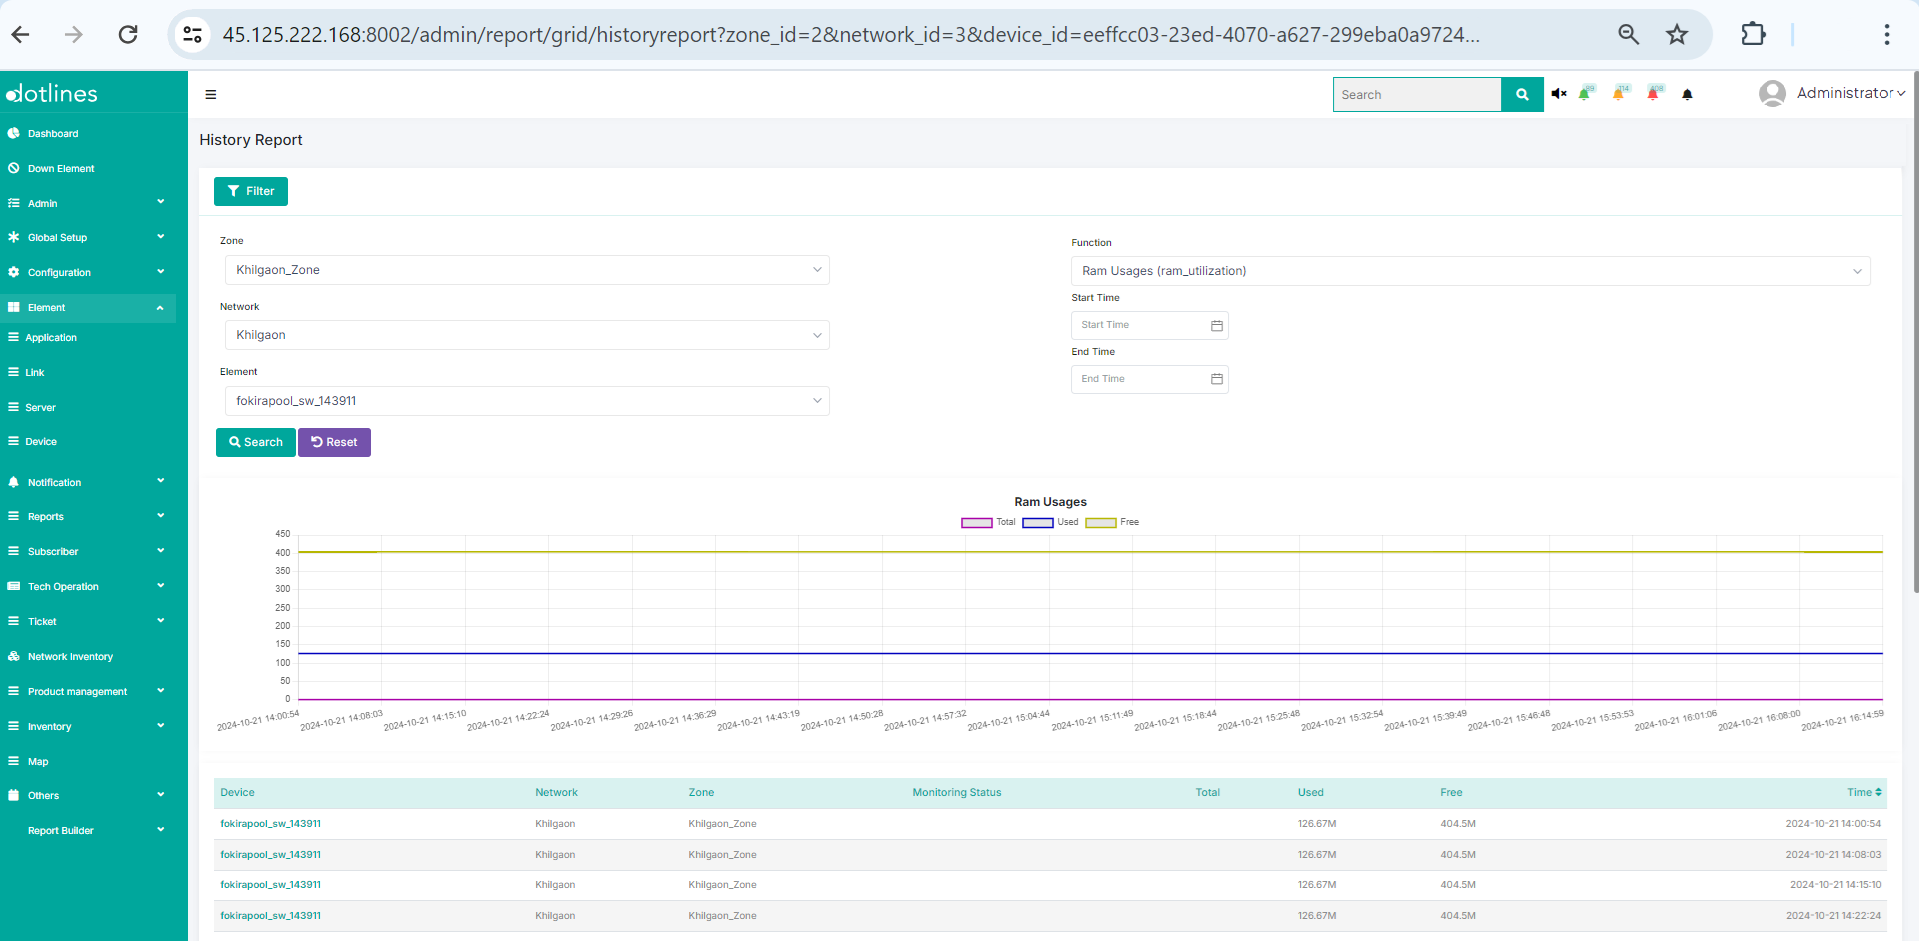
b) Click Monitoring History ![]() to get history of a monitoring device with particular monitoring criteria in details
to get history of a monitoring device with particular monitoring criteria in details

Here, we obtain a time-based breakdown of data with specific monitoring criteria in details and graph
Did this article help?