How to Retrieve a Device's Monitoring History?
Updated on 21 Oct, 2024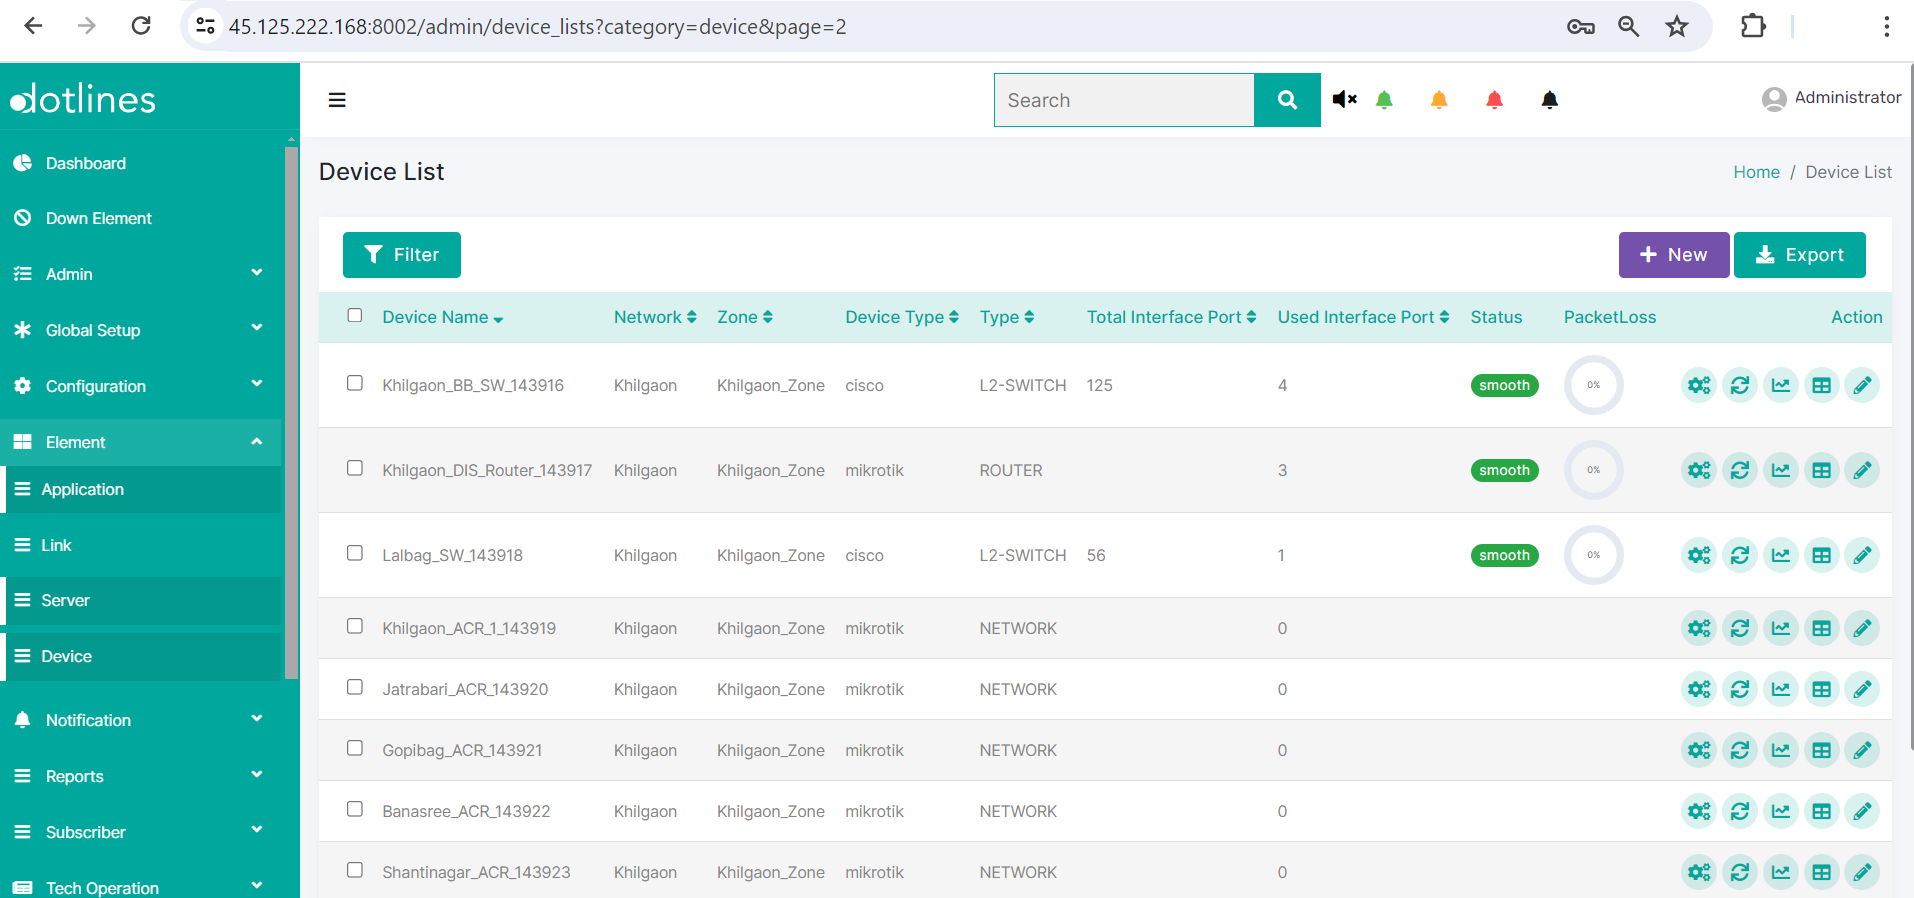
1. Go Element> Device
2. A list of server will be displayed, together with their Device Name(e.g., Khilgaon_BB_SW_143916),Network(e.g., Khilgaon),Zone(e.g., Khilgaon_Zone),Device Type(e.g., cisco),Type(e.g., L2-SWITCH),Total Interface Port,Used Interface Port,Status,Disk(%),Ram(%),CPU(%) and PacketLoss(%). If the status stays alert or down because it exceeds the threshold, the email will be escalated to the relevant group.This data can be exported in.csv format if needed.
Click Monitoring History ![]() to get history of a monitoring device with particular monitoring criteria
to get history of a monitoring device with particular monitoring criteria
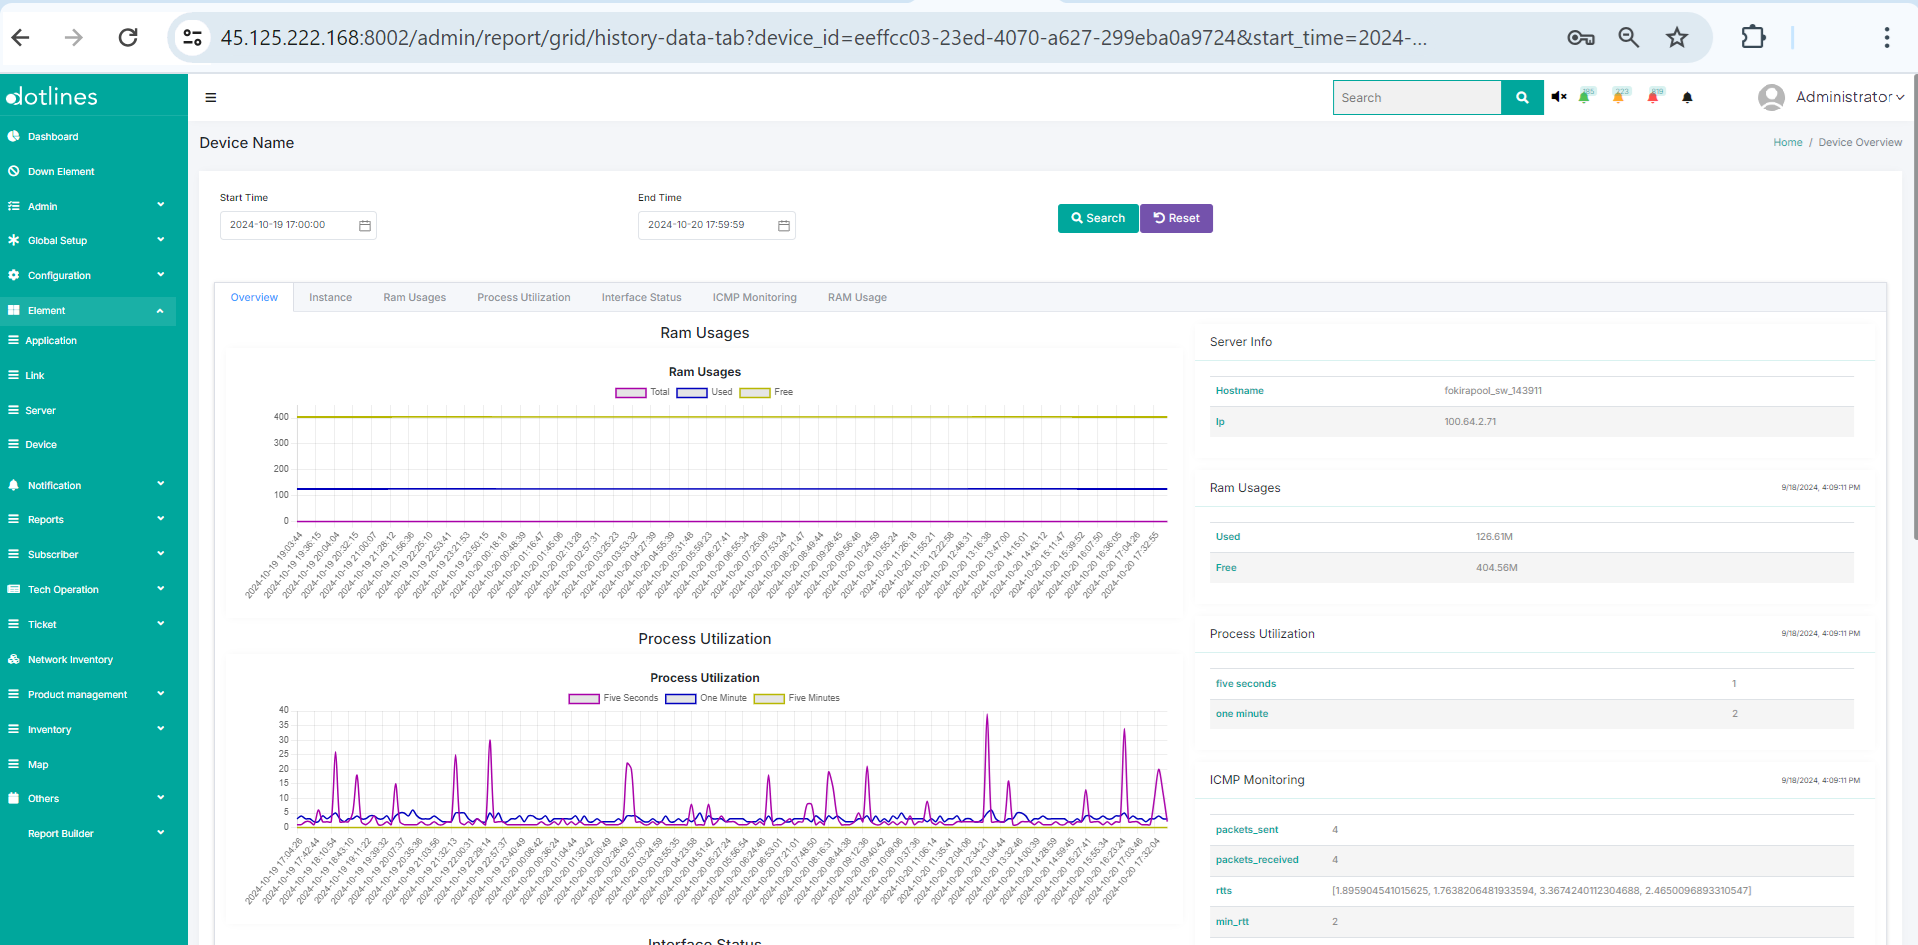
There are six sections which can be filtered by date-time:
1) Overview :
- RAM Usage: Displays a graph showing total, used, and free memory.
- Process Utilization: Graph depicting data over intervals of 5 seconds, 1 minute, and 5 minutes.
- Interface Status: Details link status, input rate, and output rate.
- ICMP Monitoring: Provides information on packets sent and received, round-trip times (RTTs), minimum, maximum, and average RTTs, packet loss, and jitter.
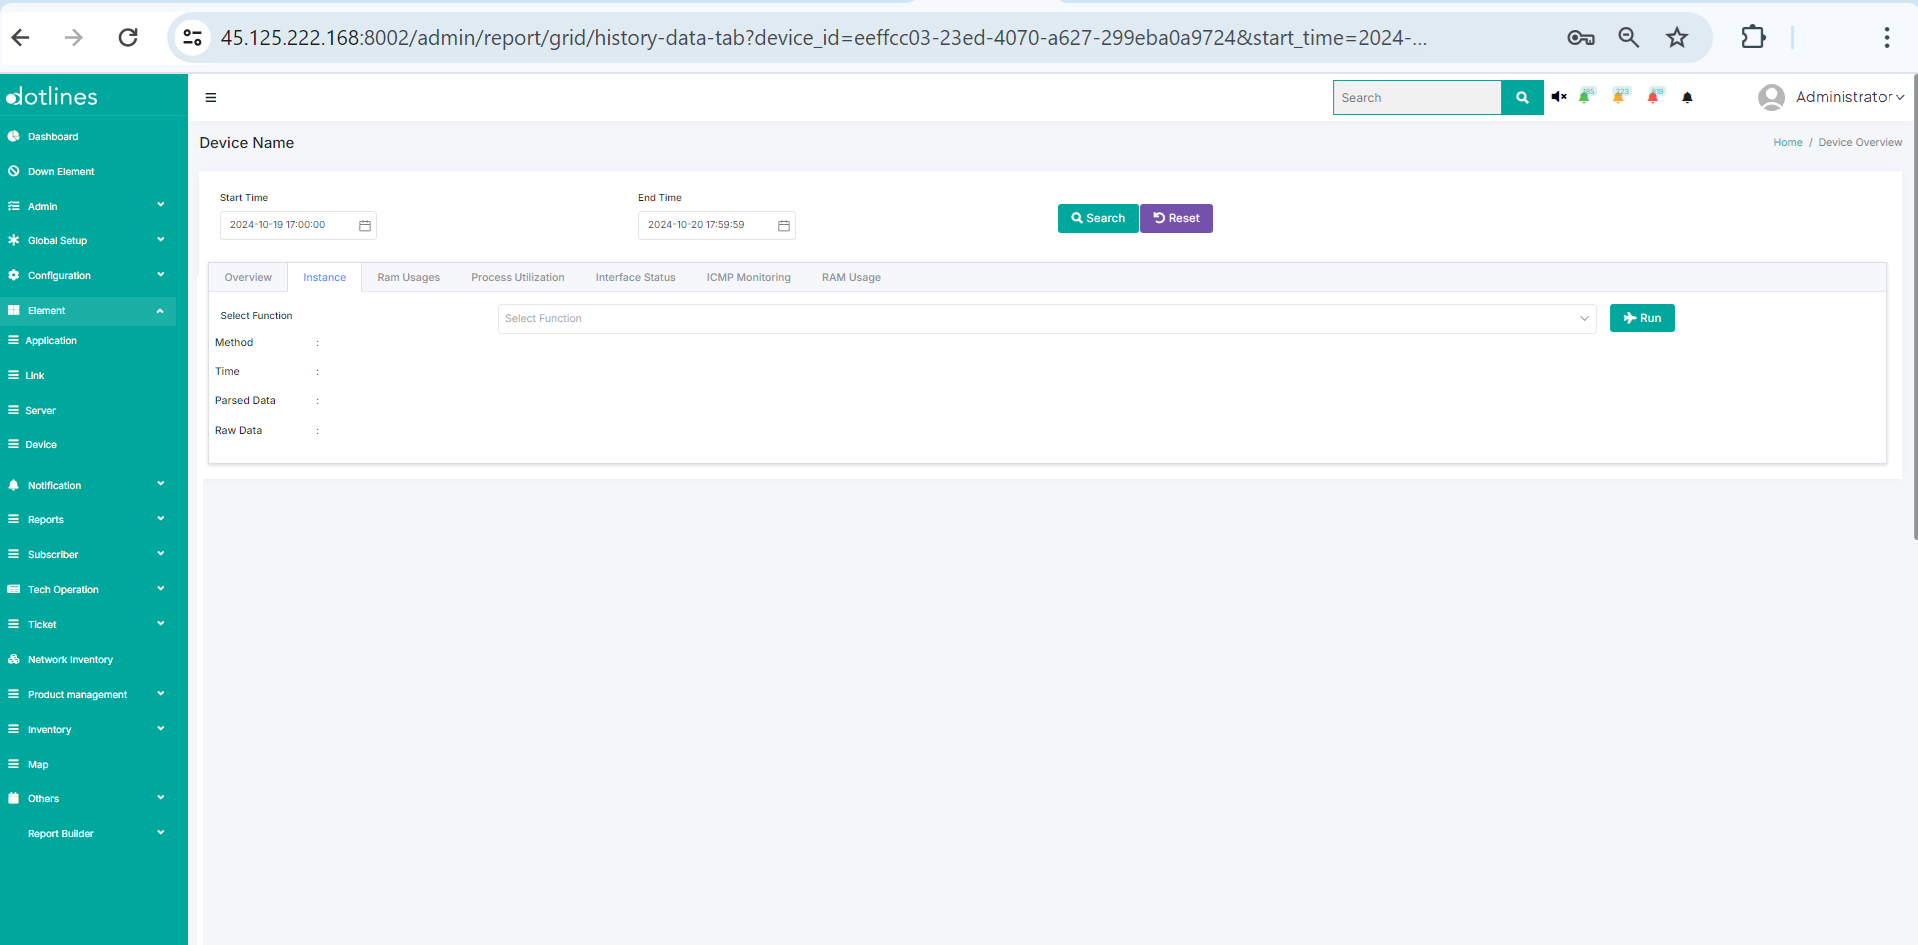
2) Instance :
- Function: Allows selection of provisioning.
- Method: Specifies the method used (e.g., command).
- Time: Follows ISO 8601 date format.
- Parsed Data: Displays processed data.
- Raw Data: Shows unprocessed data.
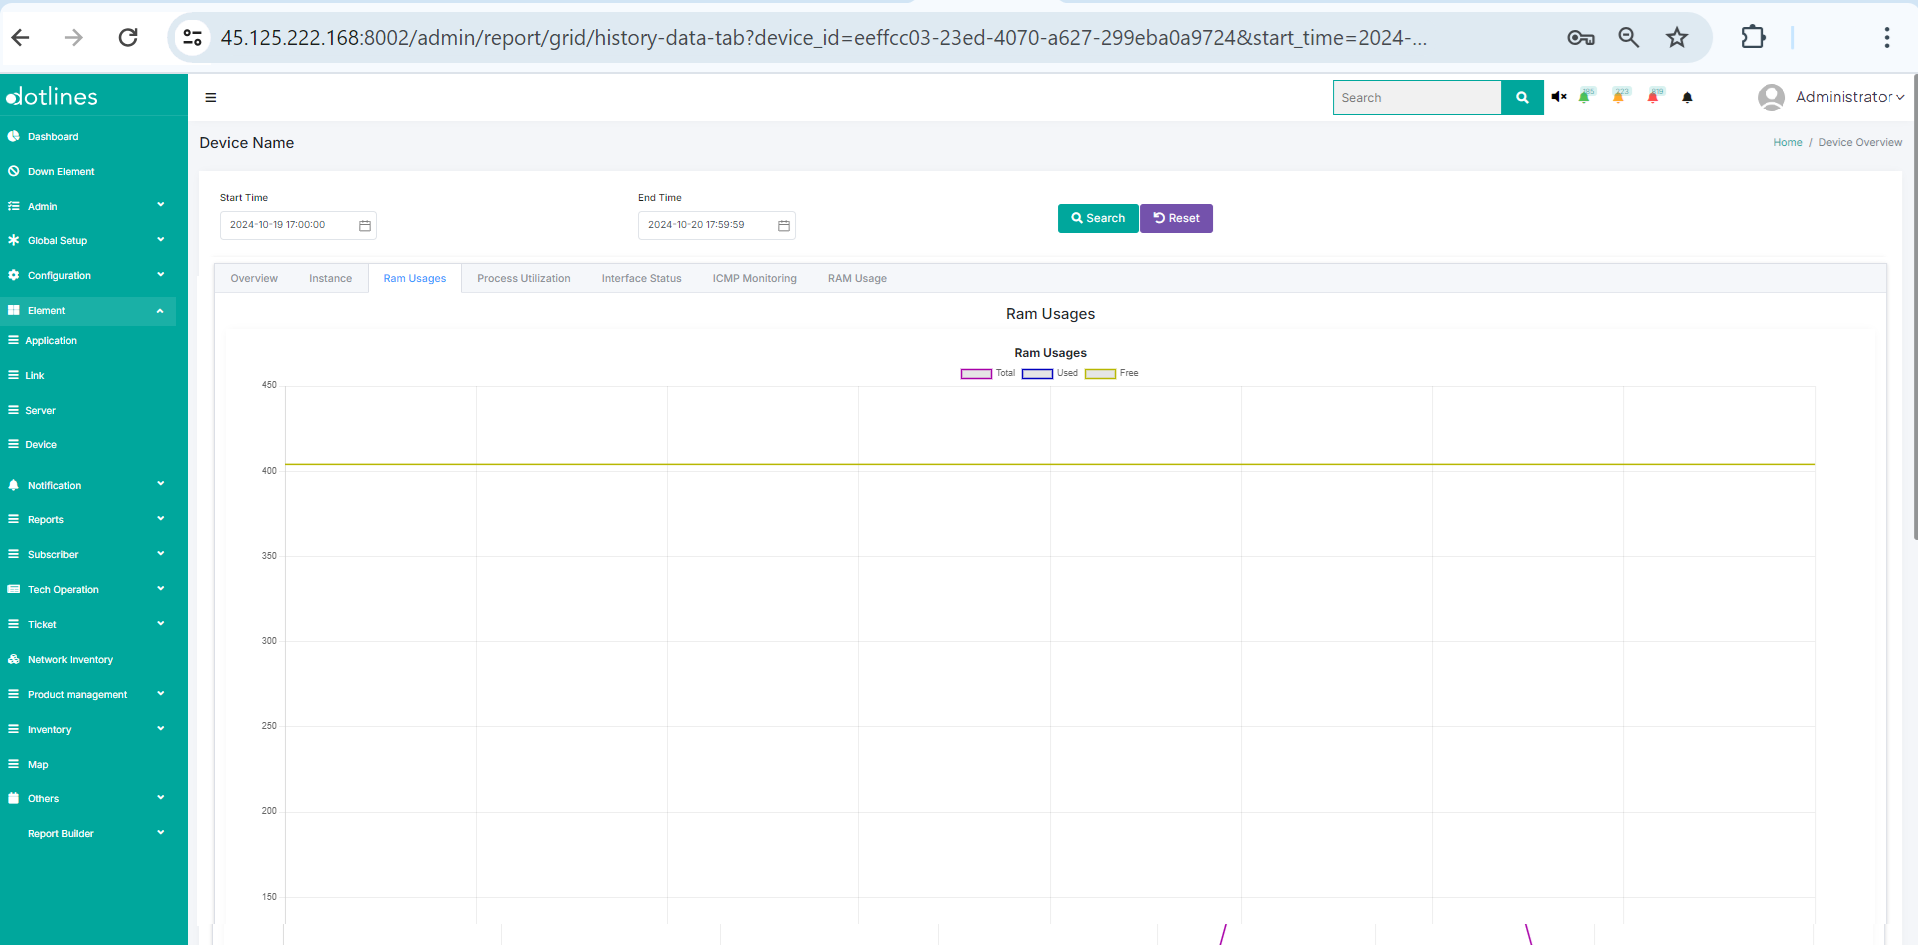
3) RAM Usage : Presents data categorized by total, used, and free memory.
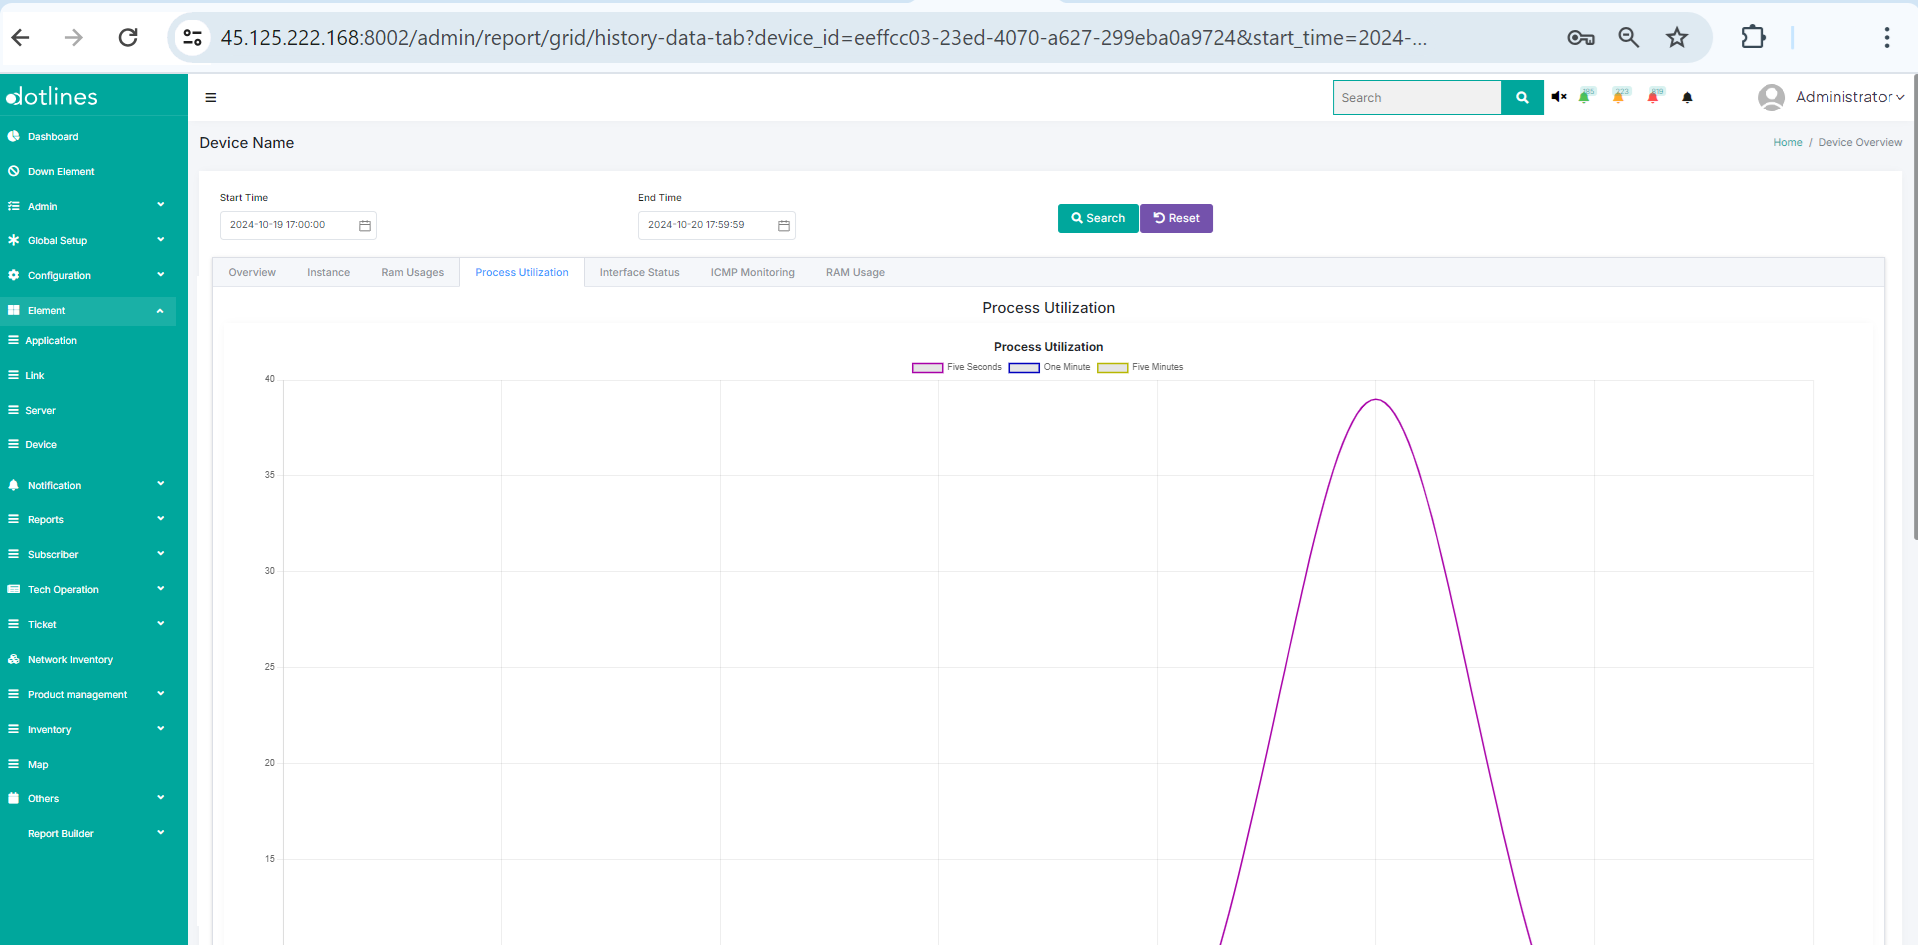
4) Process Utilization : Displays data over intervals of 5 seconds, 1 minute, and 5 minutes.
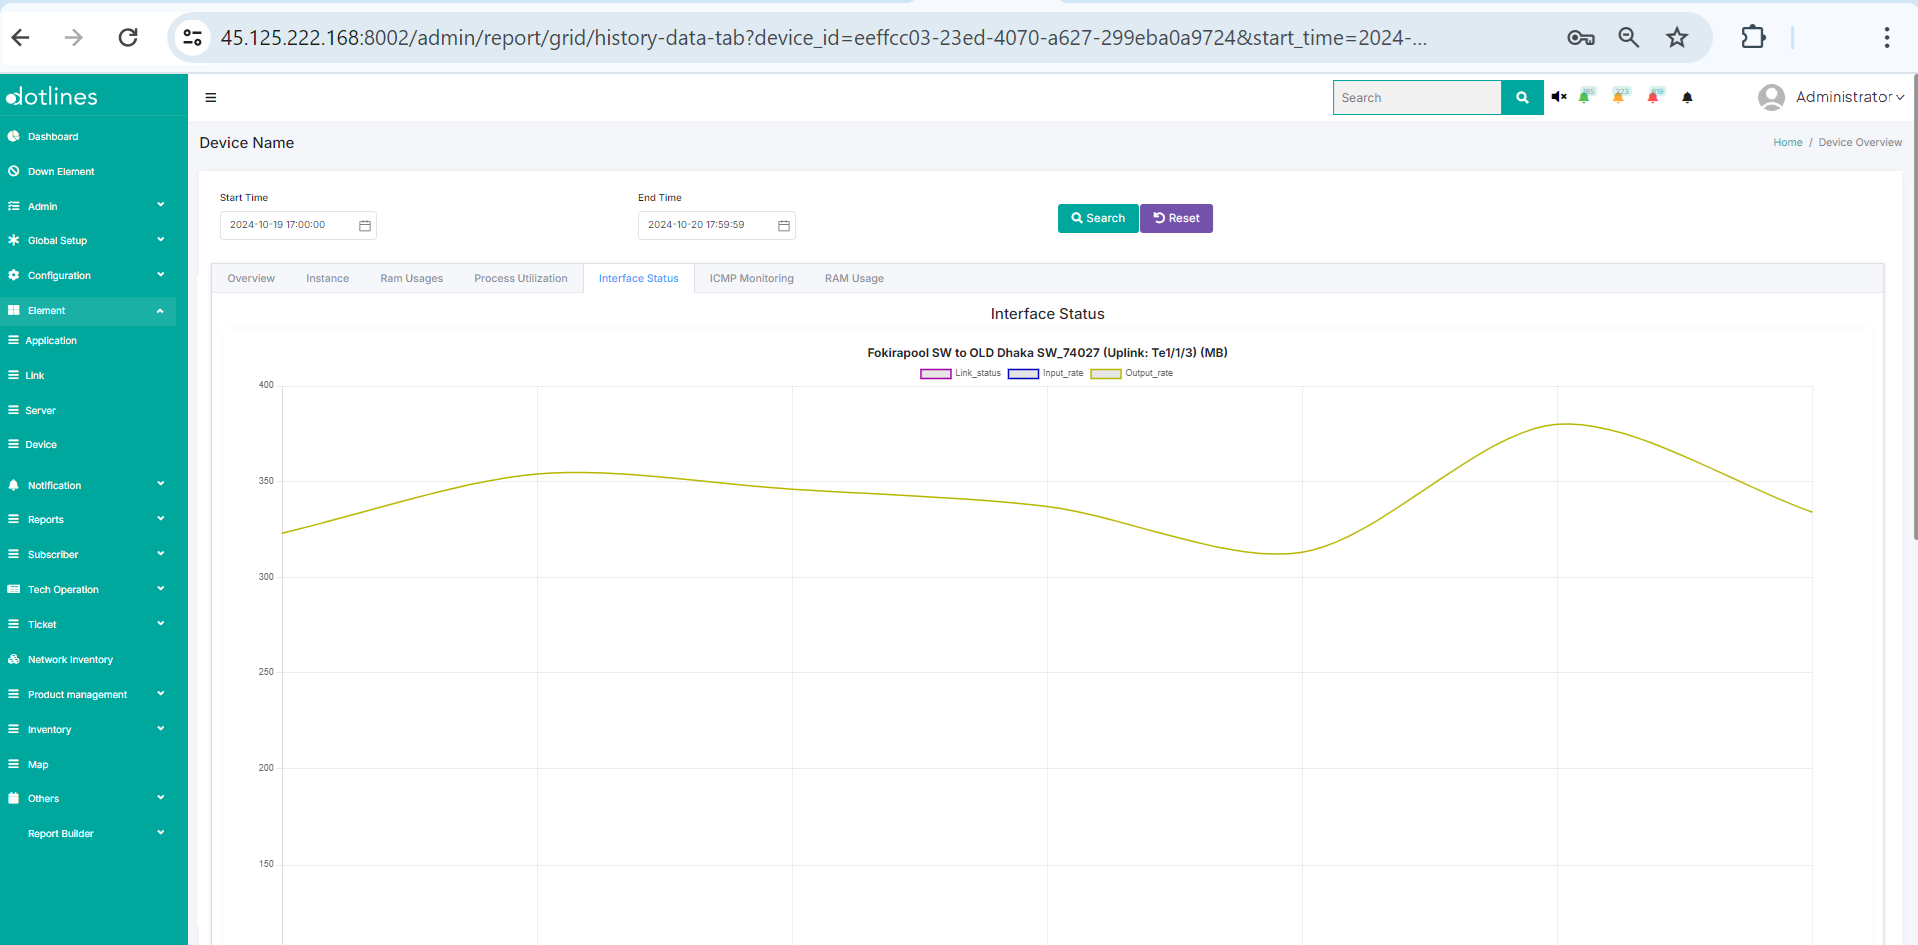
5) Interface Status : Provides data on link status, input rate, and output rate.
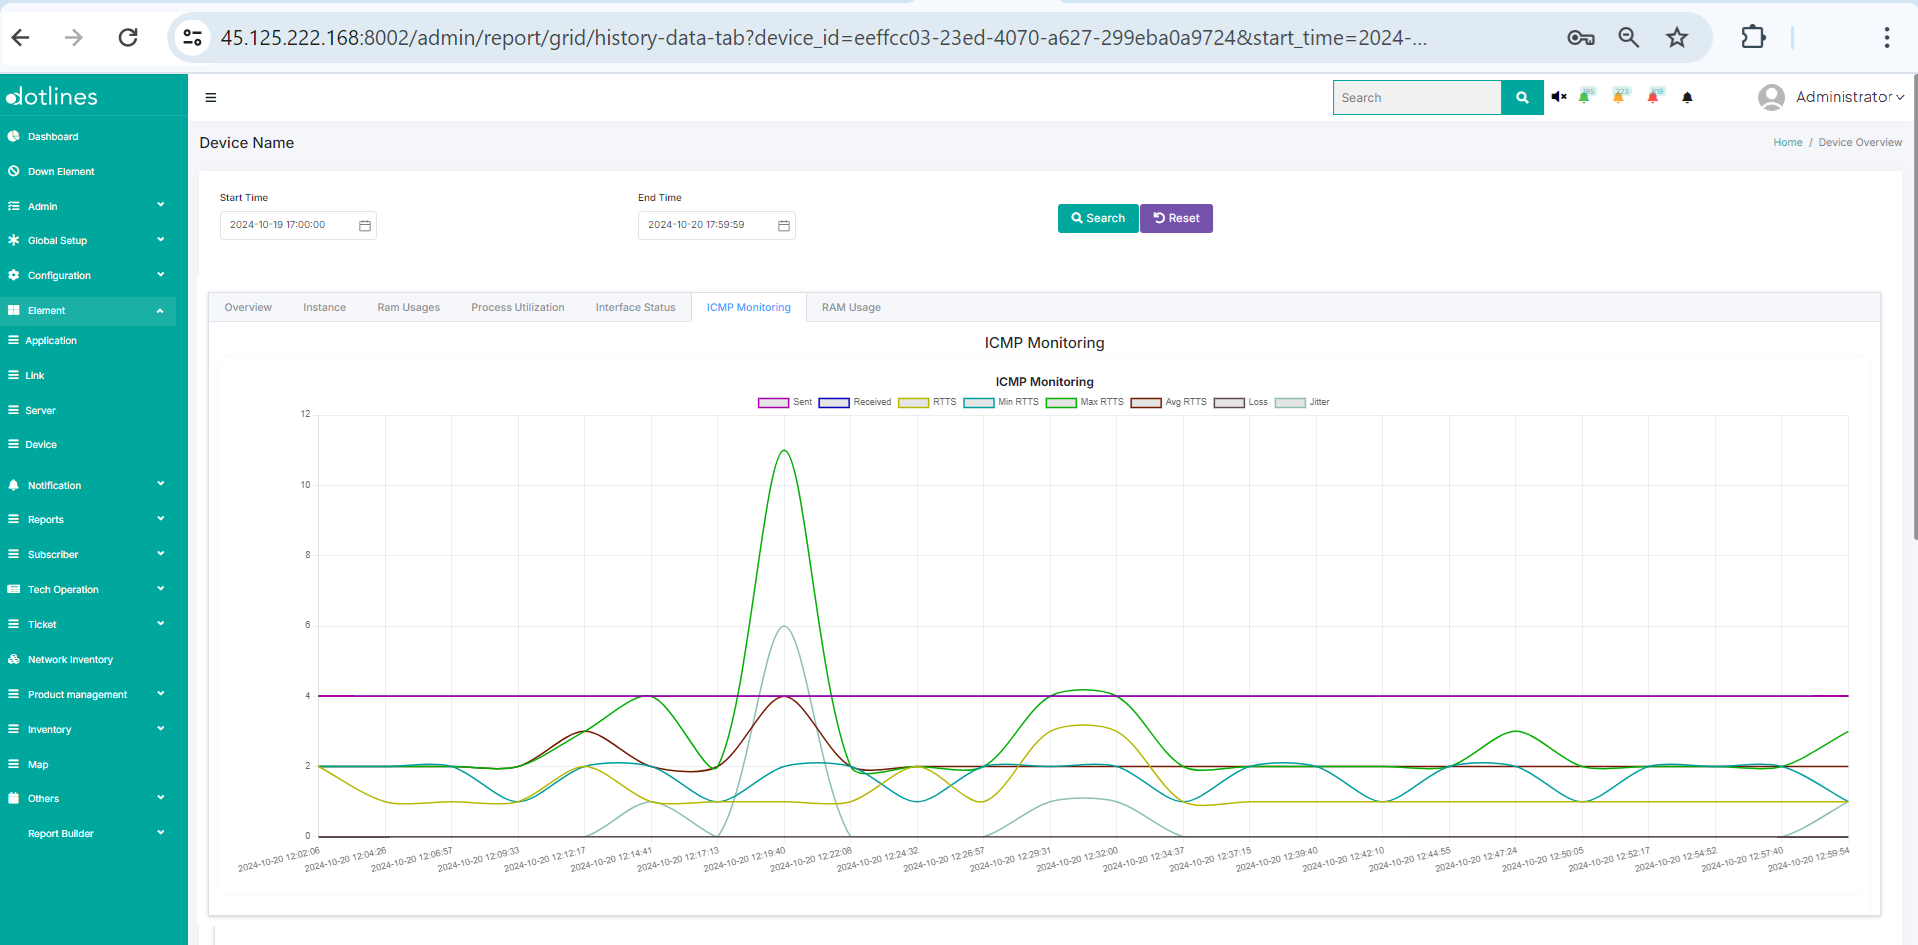
6) ICMP Monitoring : Shows data on packets sent, received, RTTs (minimum, maximum, and average), packet loss, and jitter.
Did this article help?