Ticket System / What Is Backlogs And Predicted Backlogs Report?
Updated on 04 Mar, 2024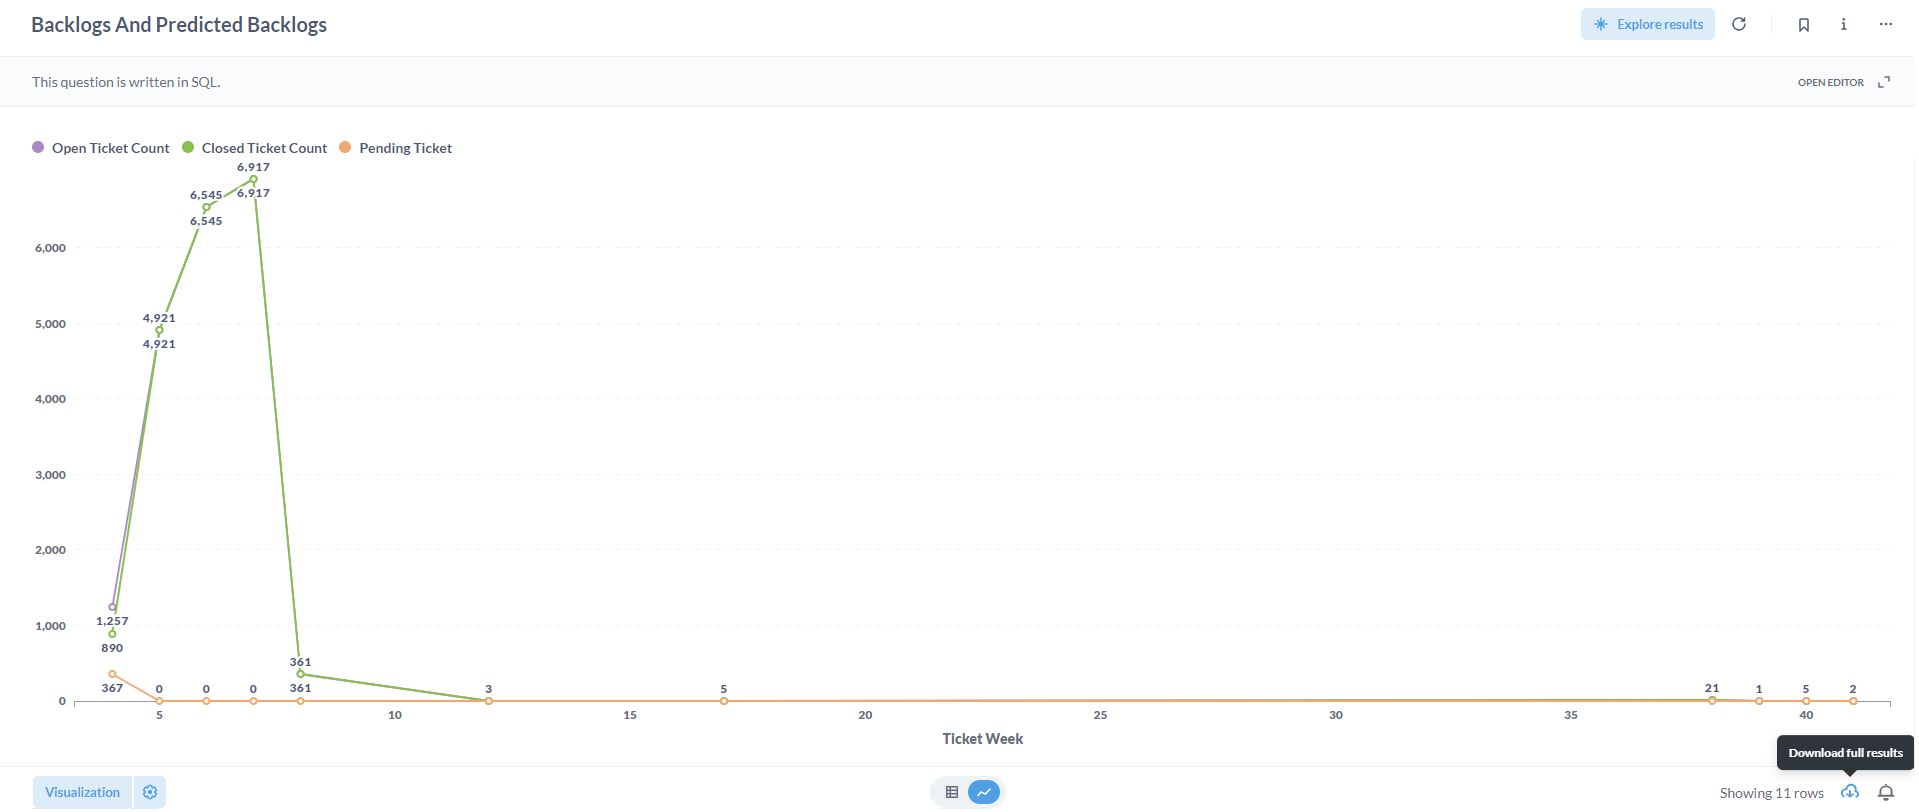
The Backlogs and Predicted Backlogs Report enabled us to discover capacity and areas for improvement in terms of helpdesk efficiency. Here are our two presentation formats-
1. Graphical Presentation:
This section of the report shows how many open, closed, and pending tickets there are for each ticket week.
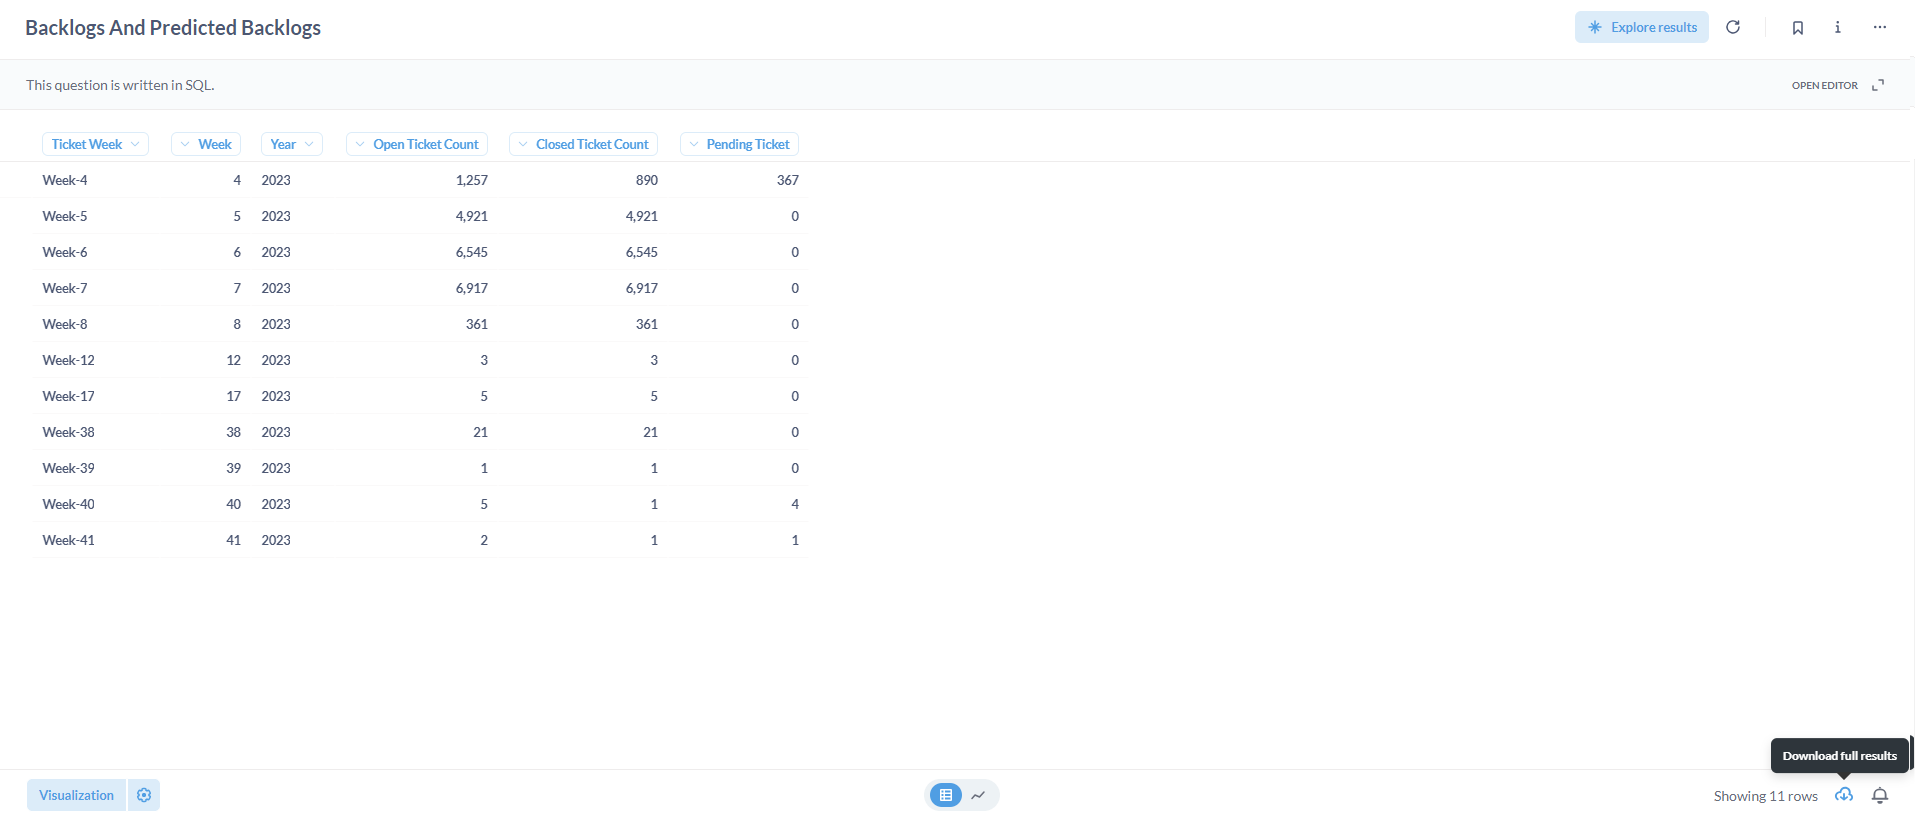
2. Tabular Presentation:
This part presents data in a tabular style with a graphical viewpoint, including ticket week, calendar week, calendar year, open ticket count, closed ticket count, and pending ticket.
If necessary, each presentation can be exported in various formats including .csv, .xlsx, .json, and .png by utilizing the Download full results button. This functionality enables users to access and utilize the data in their preferred format for further analysis or documentation purposes.
Did this article help?