Ticket System / What is Customer Satisfaction Ratings Report?
Updated on 29 Feb, 2024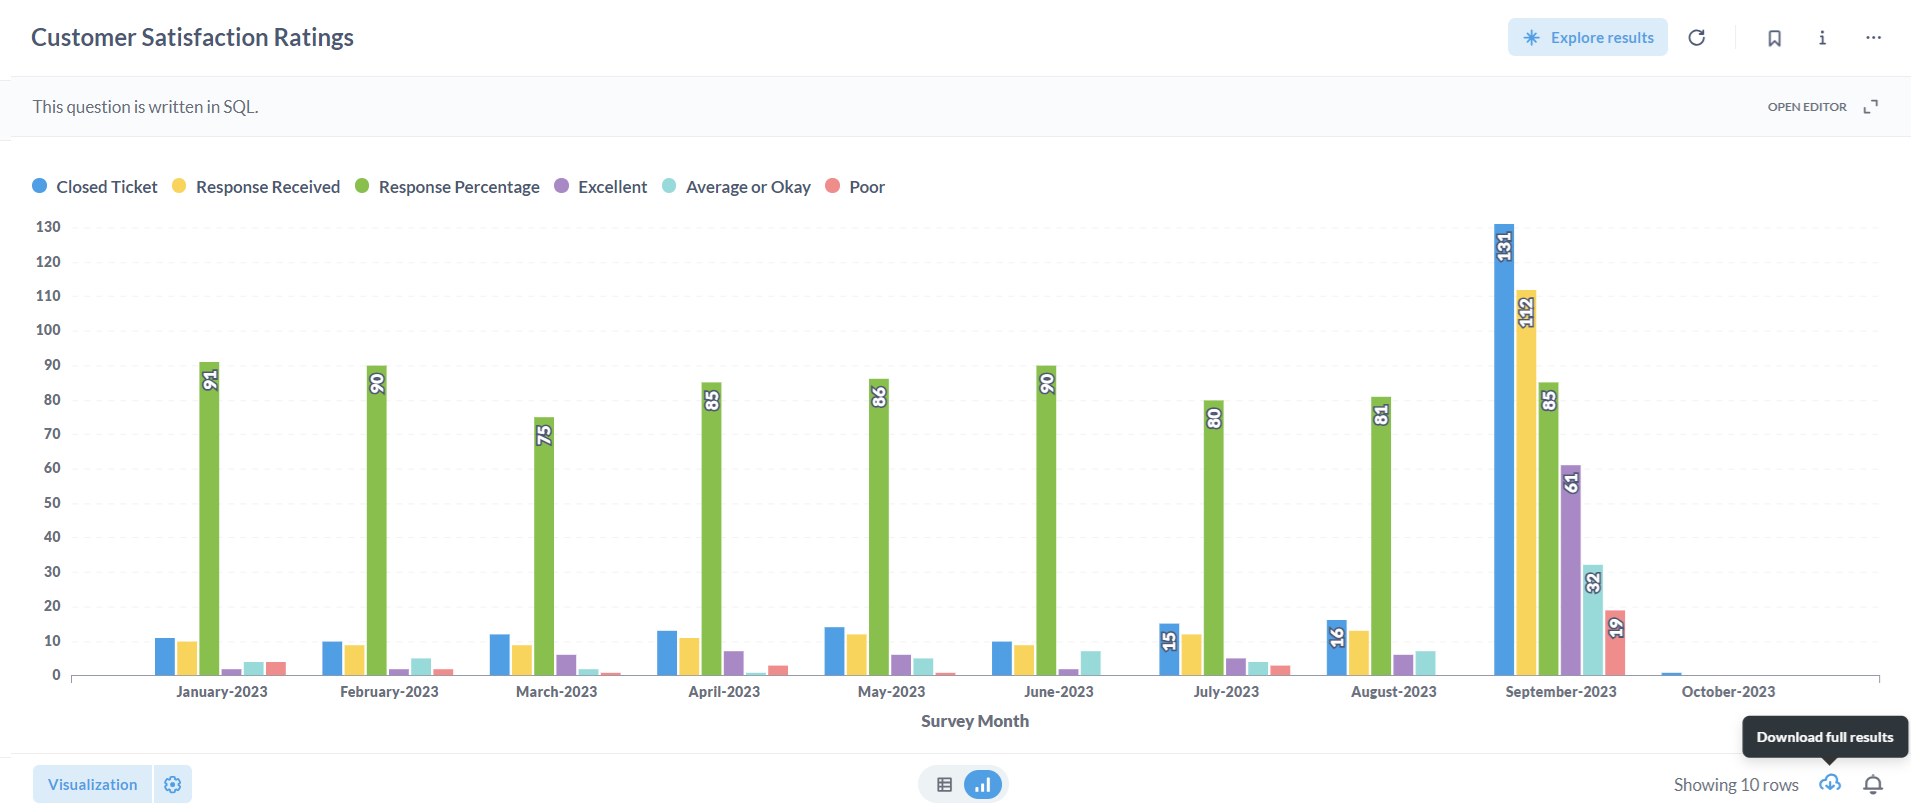
One essential indicator used to assess the effectiveness of our operations is the Customer Satisfaction (CSAT) Ratings Report. Maintaining and exceeding client expectations is critical to increasing retention rates and developing client loyalty. Since sales income and CSAT scores are directly correlated, any decrease in this statistic calls for quick attention and corrective action. Two separate presentation types are provided in the report to aid in thorough analysis and strategic decision making-
1. Graphical Presentation:
This section of the report provides a visual representation of monthly analysis pertaining to closed ticket counts. It includes key metrics such as the number of responses received, response percentage, and the distribution of ratings categorized as Excellent, Average, and Poor. Through graphical illustrations, this presentation format offers a clear and concise overview of customer satisfaction trends over time.
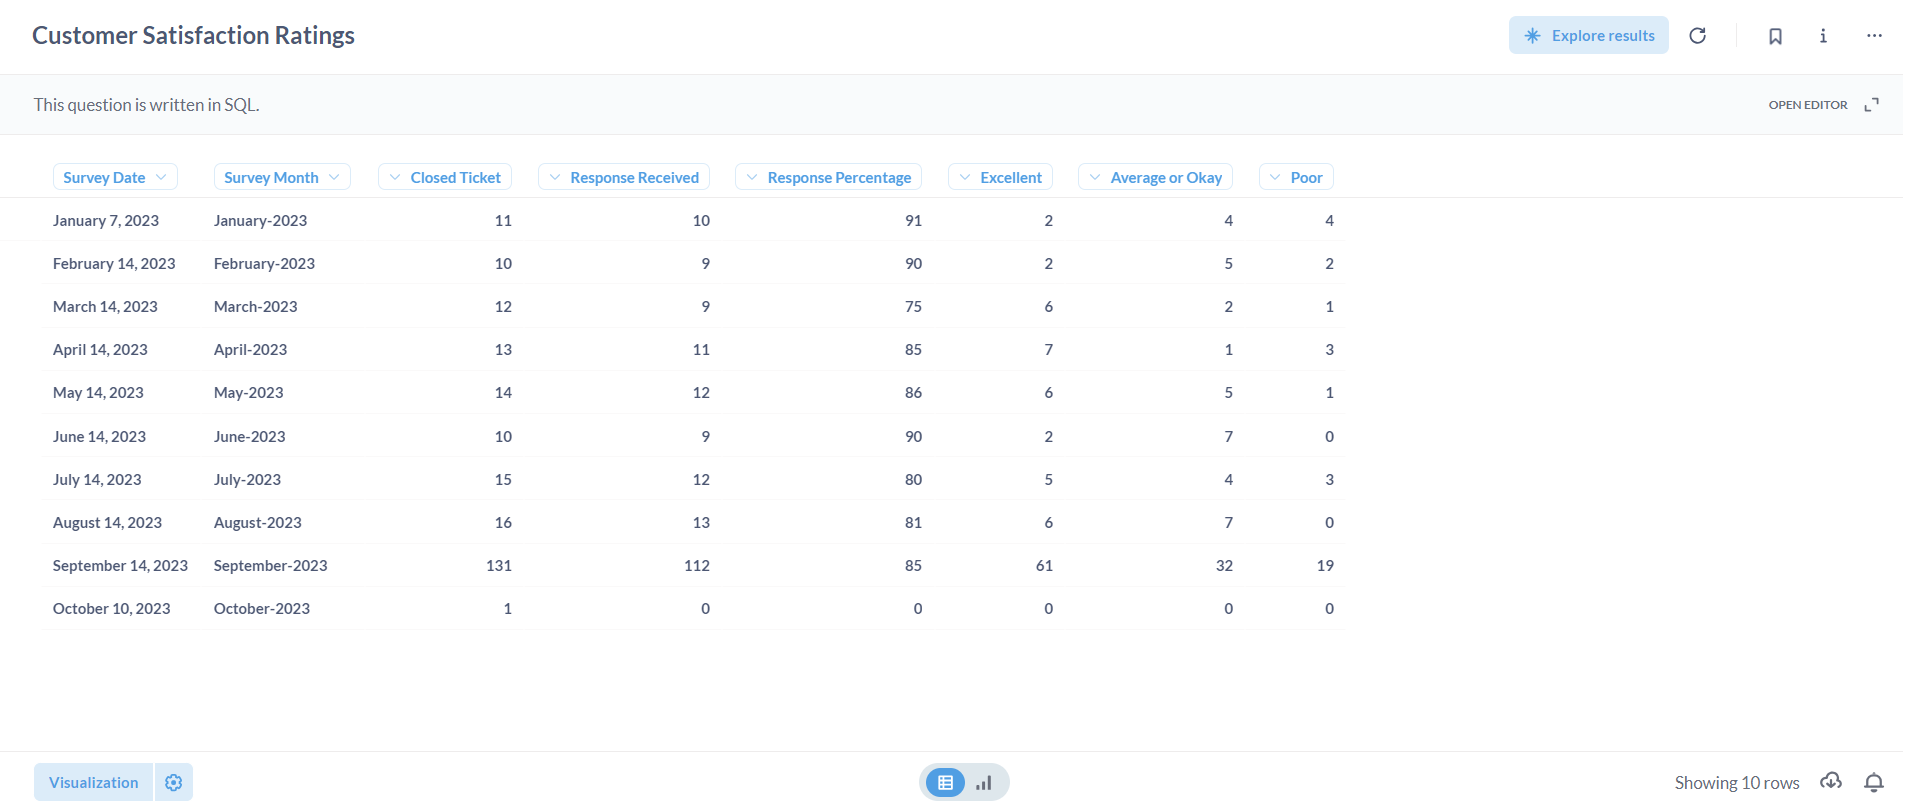
2. Tabular Presentation:
This section presents a tabular format containing detailed information corresponding to the graphical view. It includes attributes such as survey date, survey month, closed ticket counts, responses received, response percentage, as well as counts for ratings categorized as Excellent, Average, and Poor. This structured presentation allows for comprehensive examination and analysis of customer satisfaction metrics.
If necessary, each presentation can be exported in various formats including .csv, .xlsx, .json, and .png by utilizing the Download full results button. This functionality enables users to access and utilize the data in their preferred format for further analysis or documentation purposes.
Did this article help?