Ticket System / What Is Response Time Report
Updated on 03 Mar, 2024
Consumers want fast, easy responses to their inquiries, and their expectations have never been higher. One crucial indicator of how well your team is satisfying this need is the speed at which you respond. Through the identification of ticket types linked to your quickest and slowest response times, you can make sure that every ticket is handled effectively, giving more urgent tickets the priority attention they need. These are our two presenting formats-
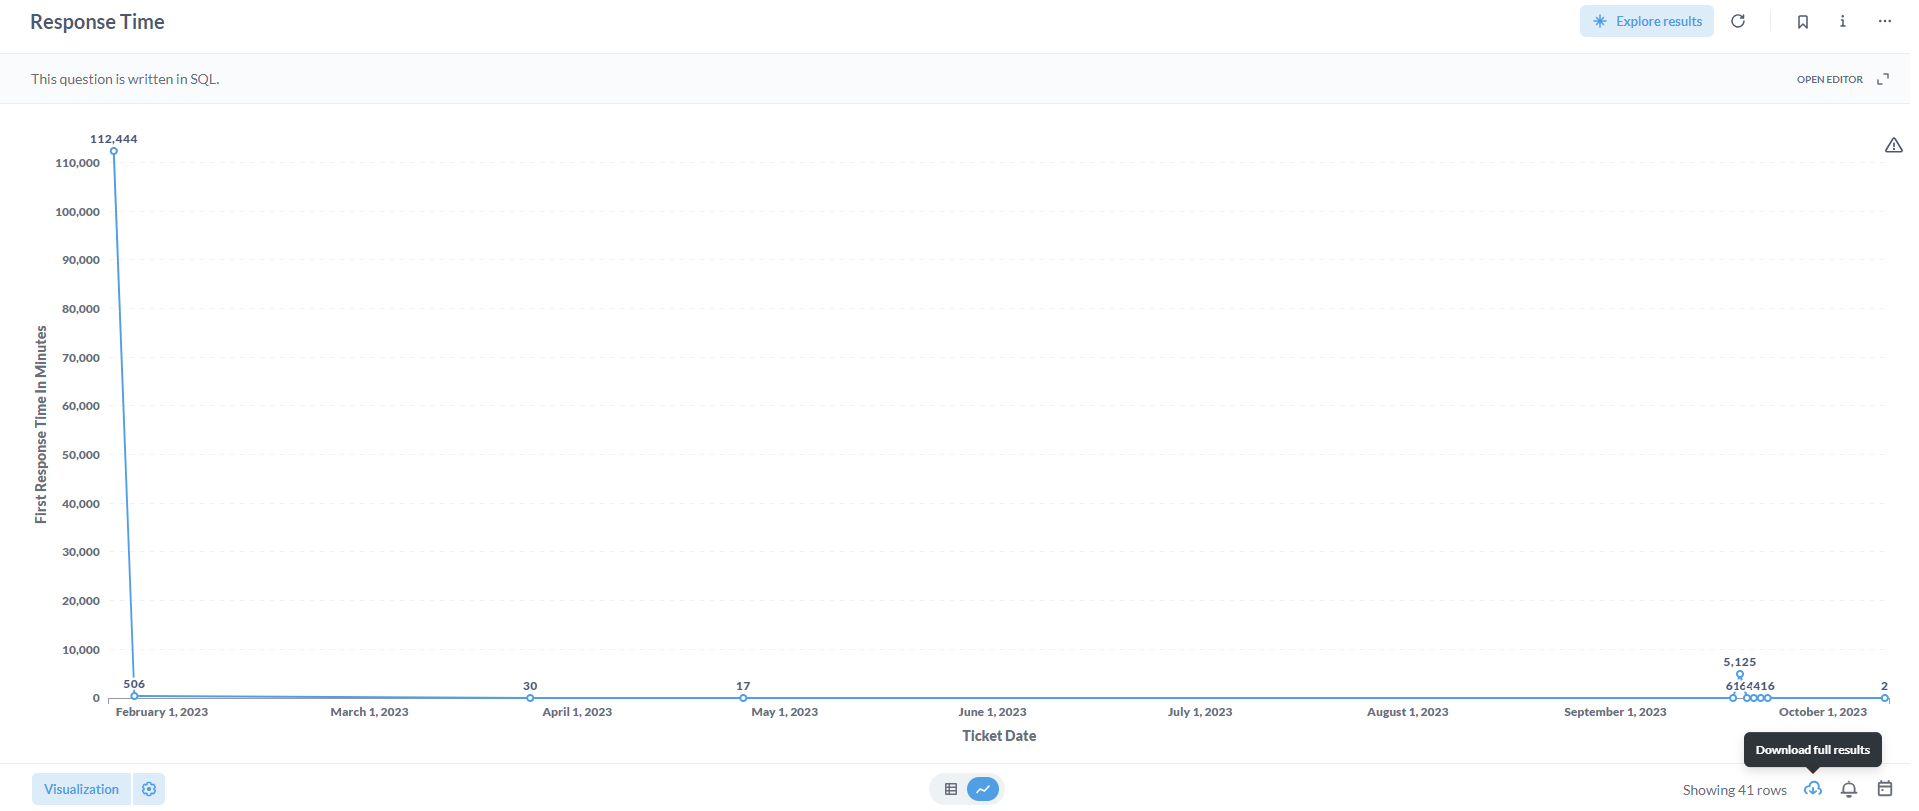
1. Graphical Presentation:
The initial response time, expressed in minutes, is provided per ticket date in this section of the report.

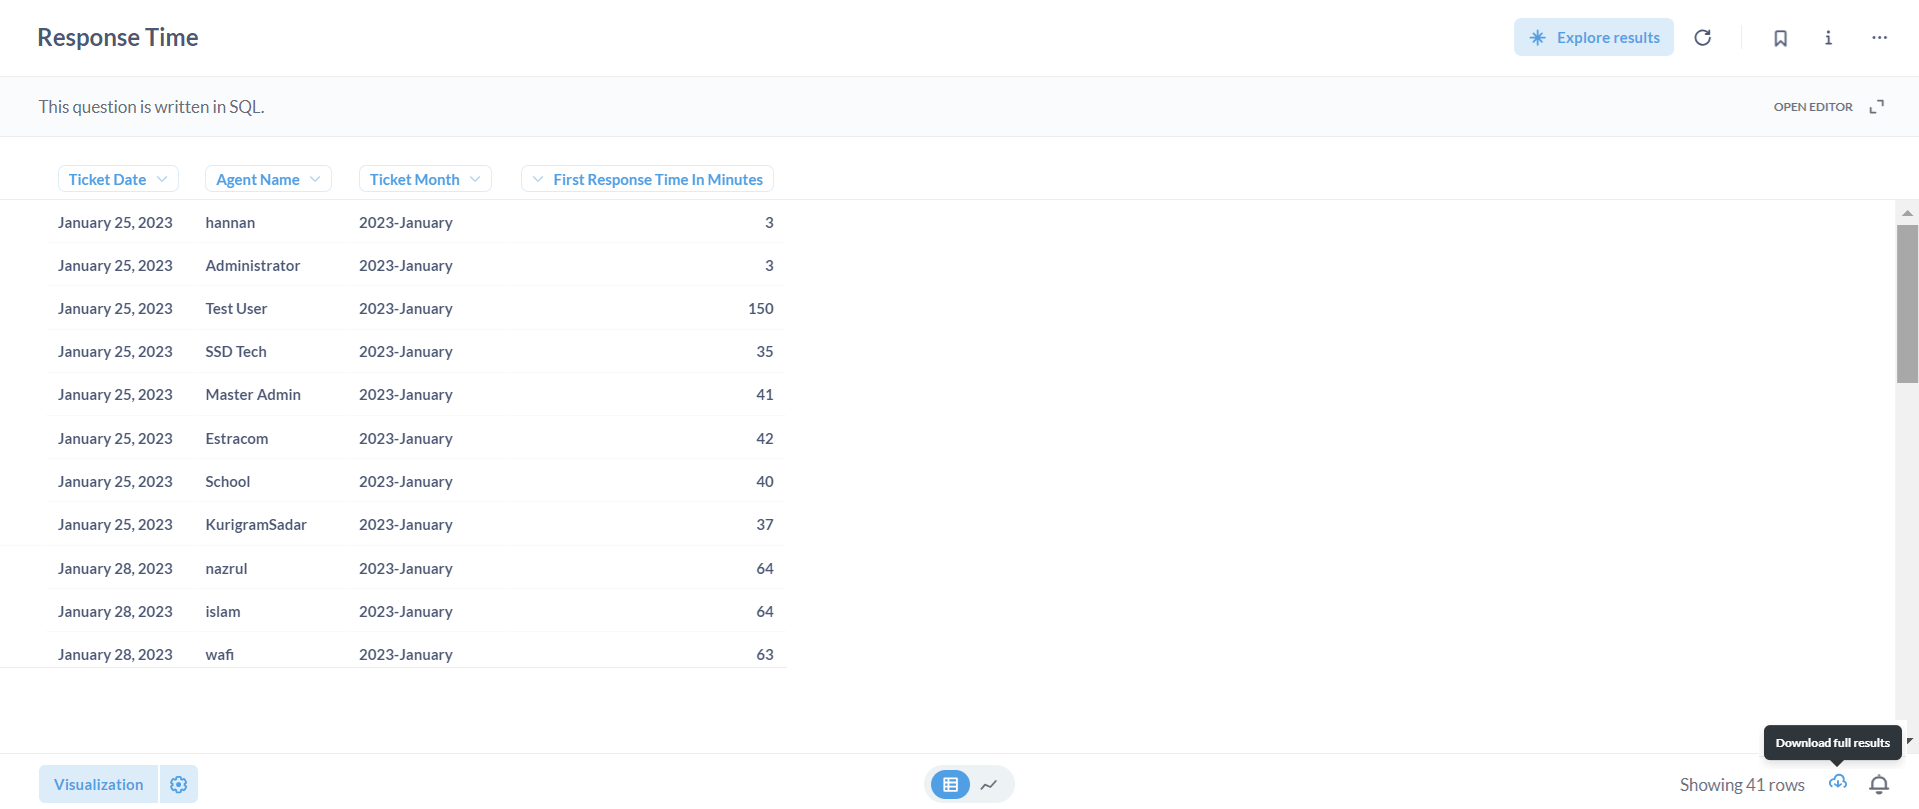
2. Tabular Presentation:
The tabular form with graphical view data, such as the ticket date, agent name, ticket month, and initial response time (in minutes), is shown in this part.
If necessary, each presentation can be exported in various formats including .csv, .xlsx, .json, and .png by utilizing the Download full results![]() button. This functionality enables users to access and utilize the data in their preferred format for further analysis or documentation purposes.
button. This functionality enables users to access and utilize the data in their preferred format for further analysis or documentation purposes.
Did this article help?