Ticket System / What Is Dashboard Report?
Updated on 29 Feb, 2024
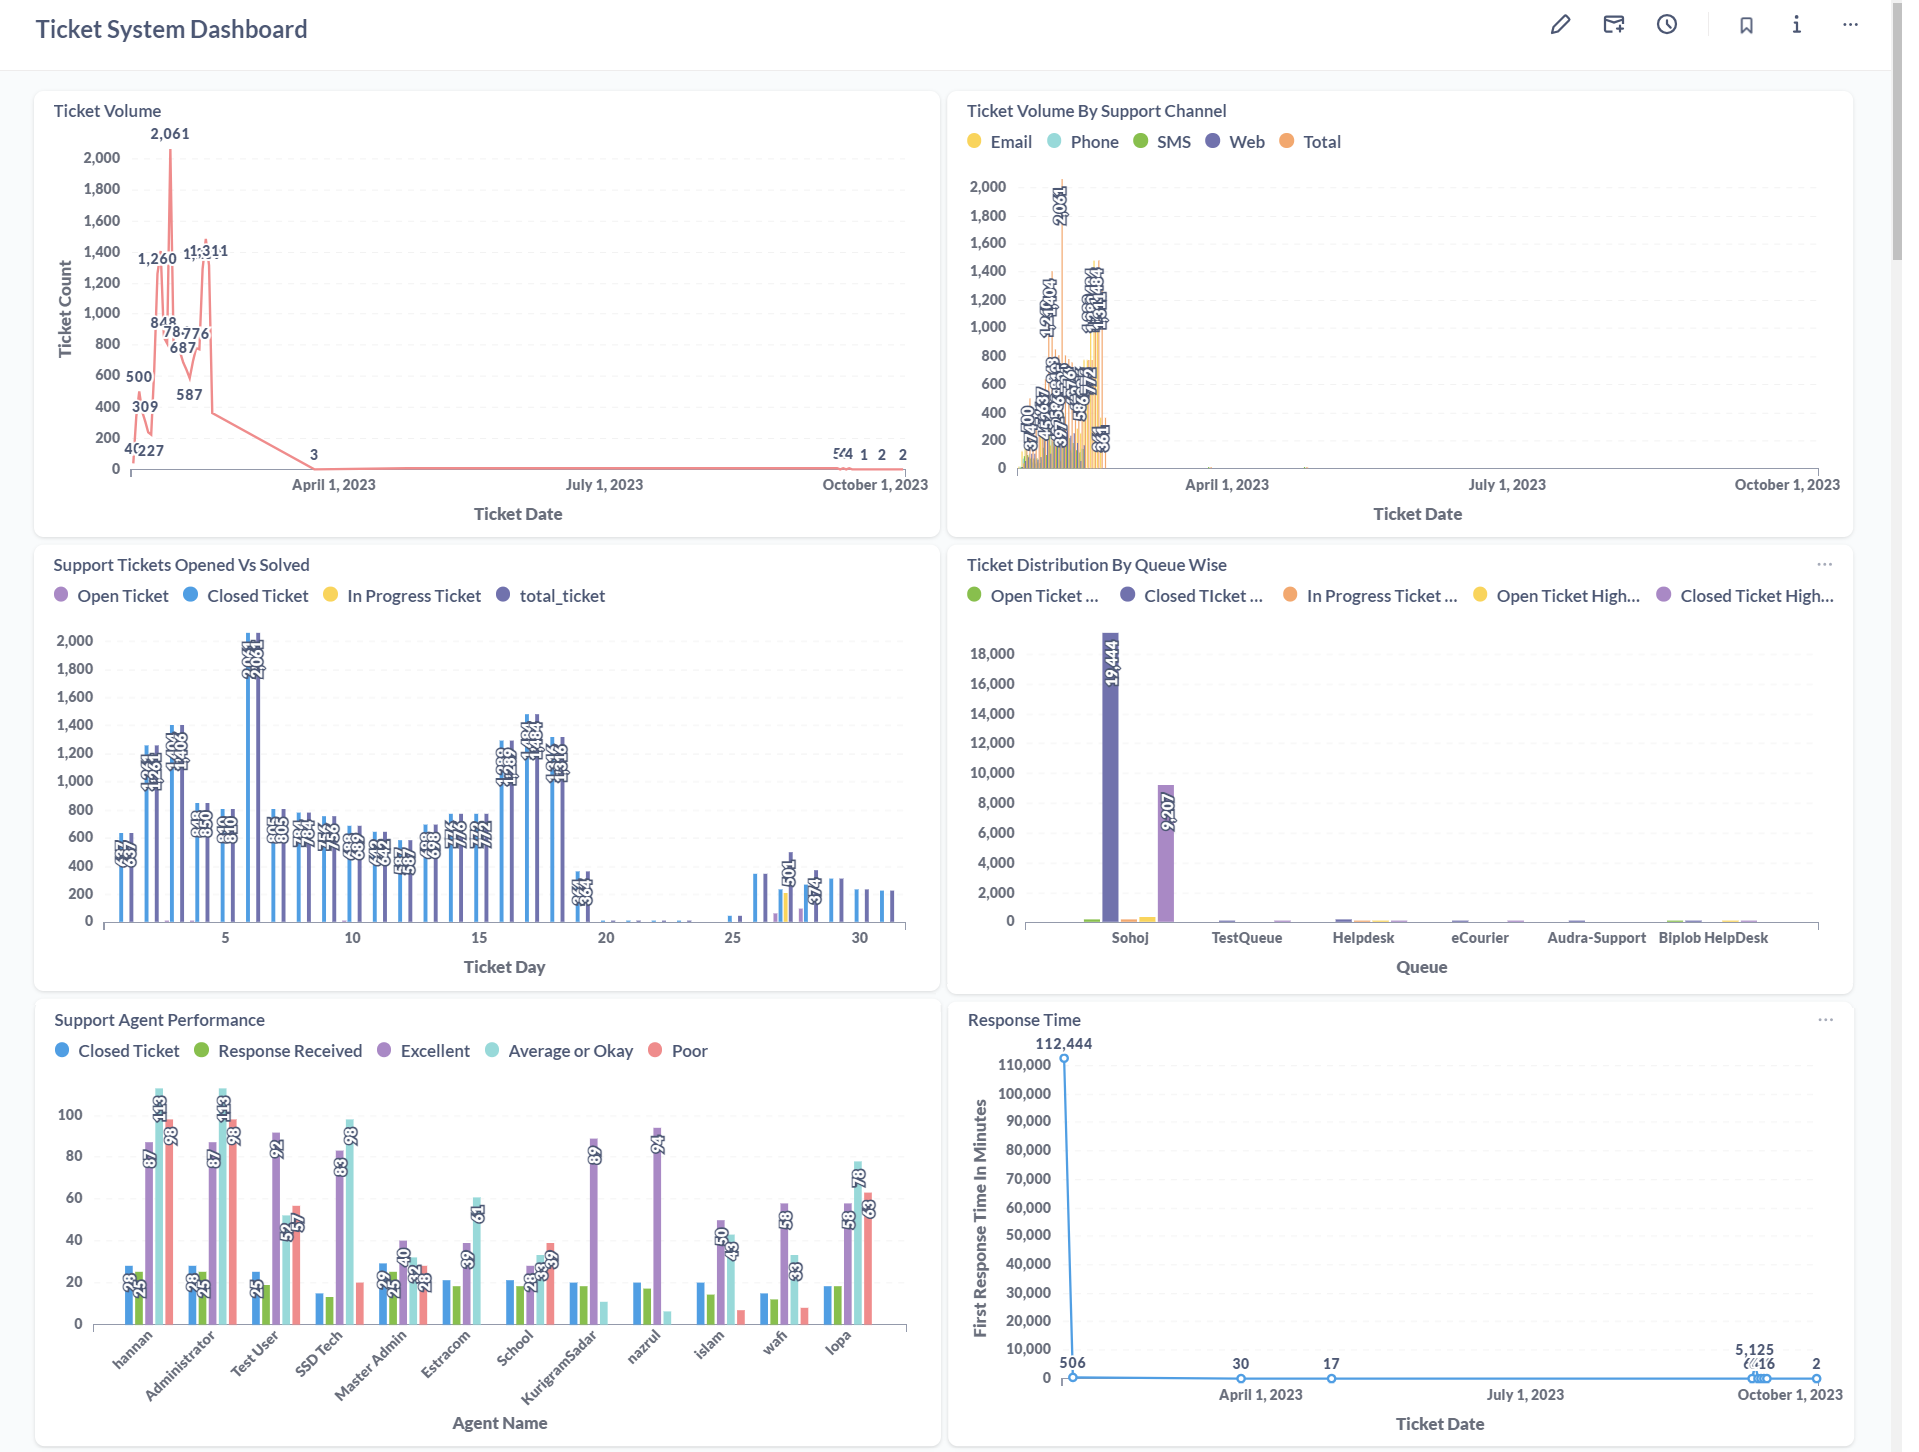
The Ticket System Dashboard Report presents an array of visual data consolidated in a single interface. This report encompasses 10 graphical representations depicting various aspects of the ticket's metrics-
1. Ticket Volume:
This section provides a chronological breakdown of ticket counts based on dates.
2. Ticket Volume By Support Channel:
This section presents the distribution of ticket counts across various support channels, such as email, phone, SMS, and web, categorized by date.
3. Support Tickets Opened Vs Solved:
Here, the report compares the counts of different ticket statuses (e.g., open, closed, in progress) on a date-wise basis.
4. Ticket Distribution By Queue Wise:
This section displays the distribution of tickets among different queues (e.g., Level1, Level2, Level3) based on date.
5. Support Agent Performance:
This segment offers a breakdown of ticket assignments among support agents, including agents' names (e.g., Agent X, Agent Y), categorized by date.
6. Response Time:
This part of the report showcases the response times for tickets on each date, specifically focusing on metrics such as first response time (in minutes).

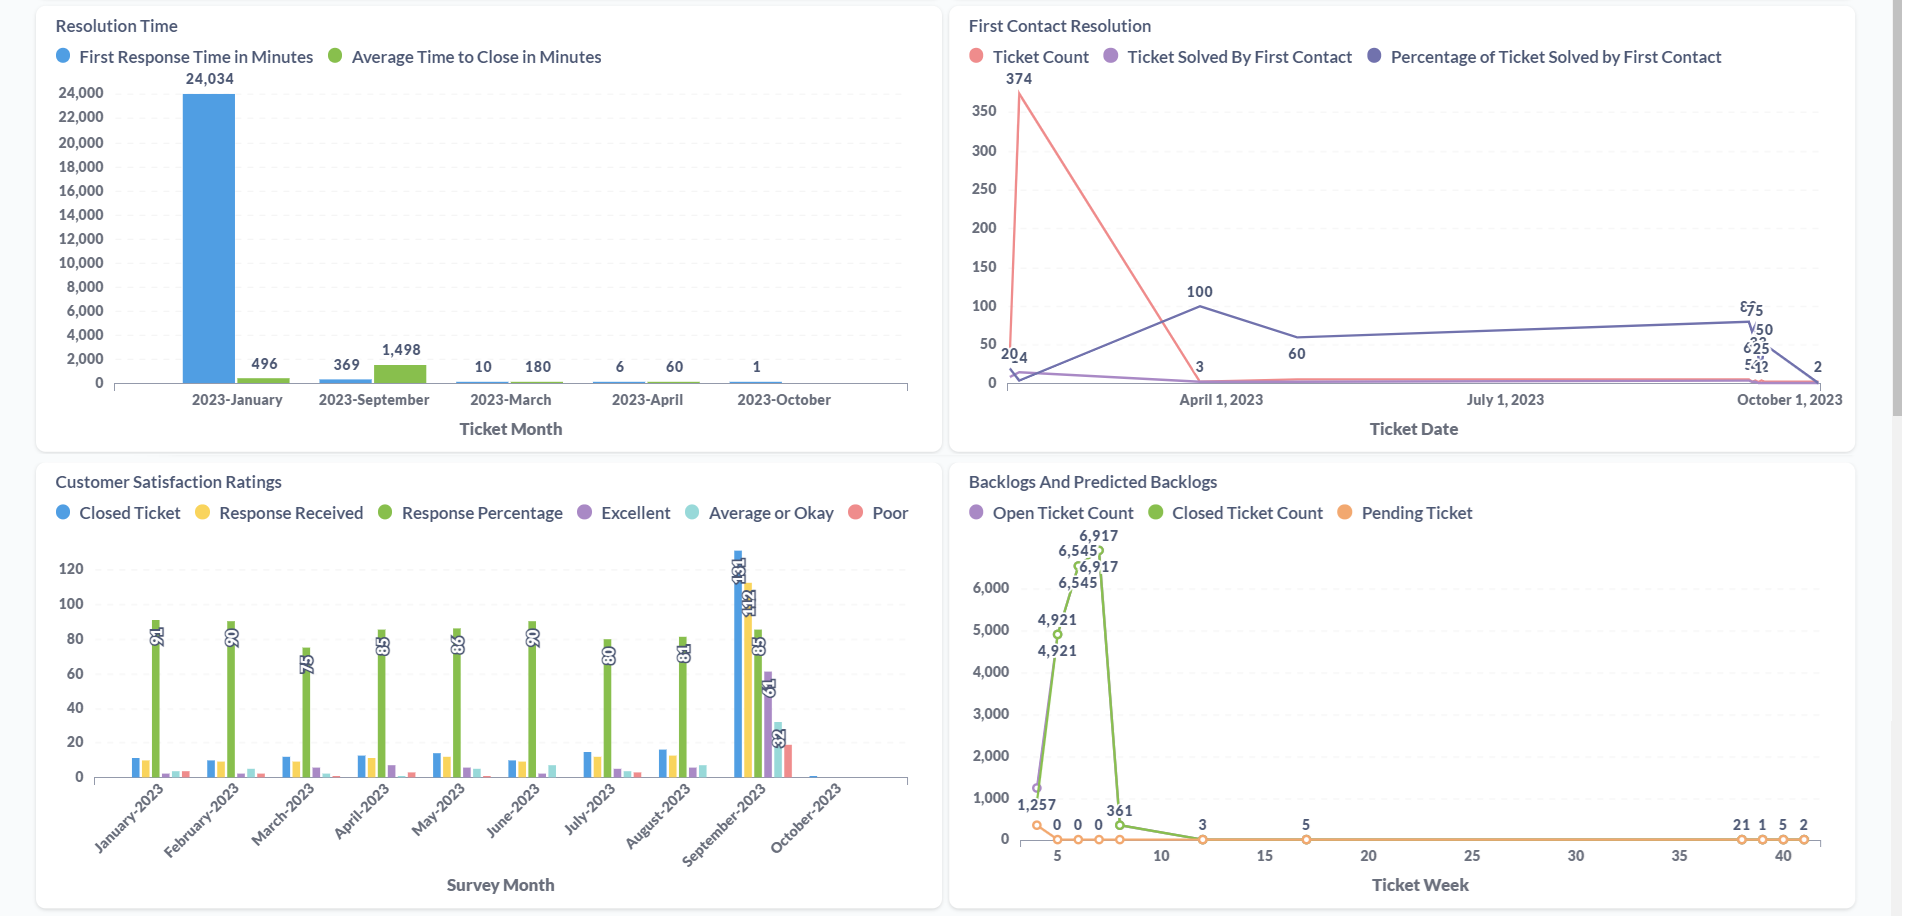
7. Resolution Time:
This section provides a breakdown of resolution times on a monthly basis, including metrics such as first resolution time (in minutes) and average time to close (in minutes).
8. First Contact Resolution:
This segment presents a date-wise overview of total ticket counts resolved upon first contact, alongside the percentage of tickets resolved at first contact.
9. Customer Satisfaction Ratings:
This part of the report offers a monthly analysis of closed ticket counts, including metrics such as response received, response percentage, and counts of ratings categorized as Excellent, Average, and Poor.
10. Backlogs And Predicted Backlogs:
Here, the report provides a weekly snapshot of open, closed, and pending ticket counts, offering insights into backlog management and predicted future backlogs.
Did this article help?