Ticket System / What Is Ticket Volume Report?
Updated on 04 Mar, 2024
The Ticket Volume Report allows you to track the overall number of conversations your team has had over a certain time period, which can provide valuable insights into the quality of your support service. Here are our two presentation formats-
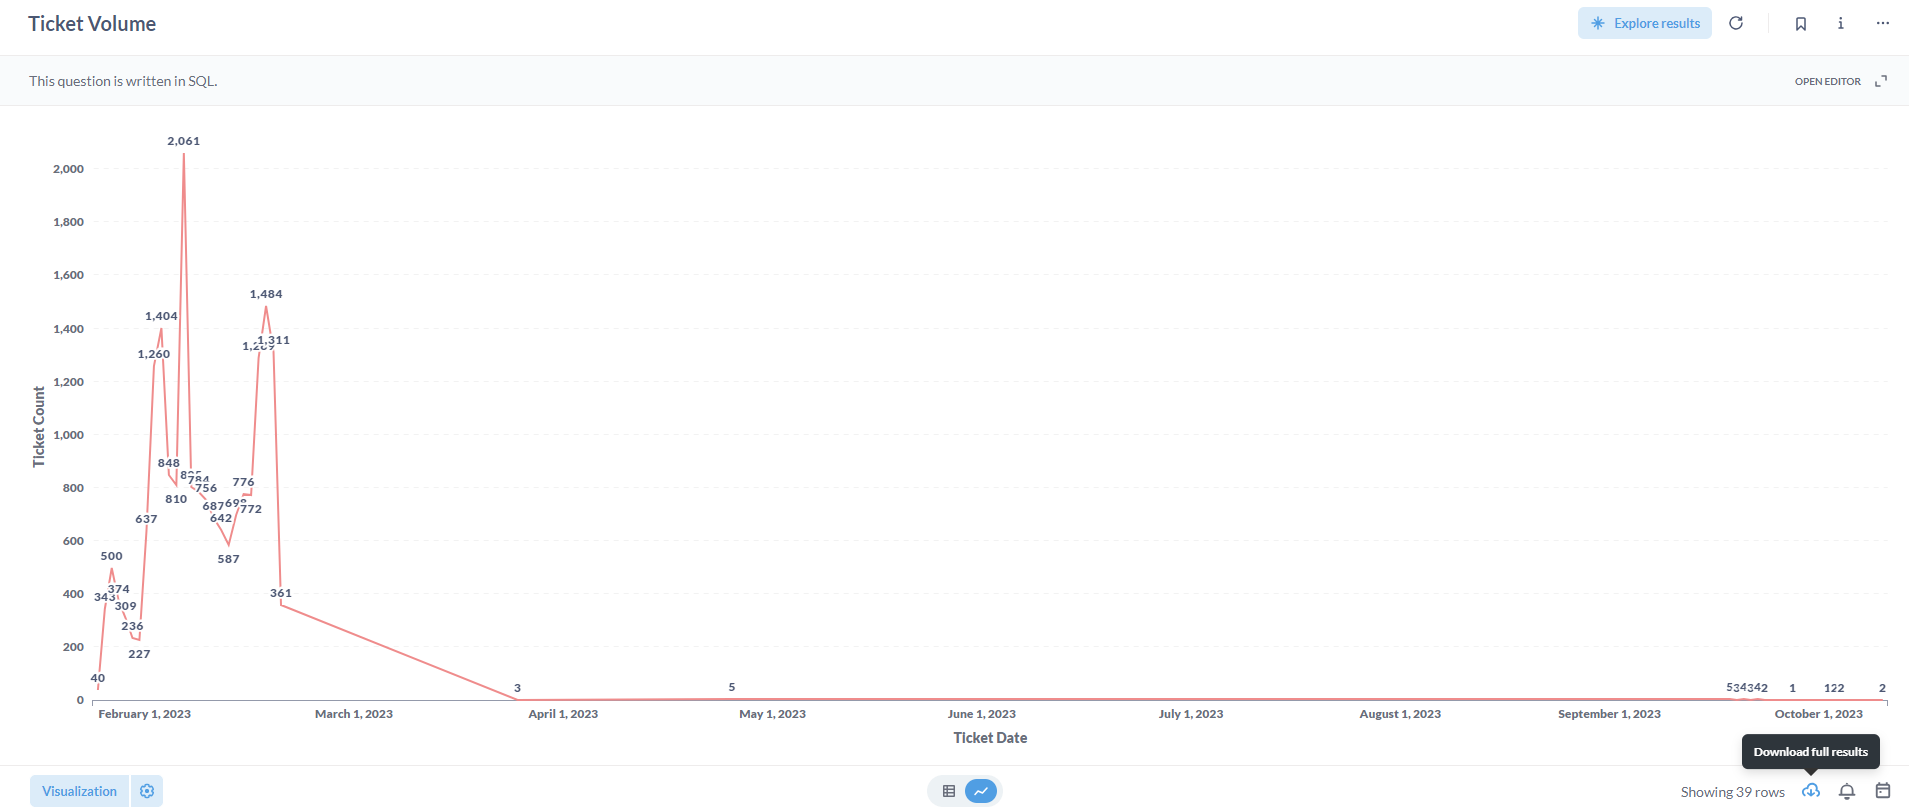
1. Graphical Presentation:
The ticket count, is provided per ticket date in this section of the report.

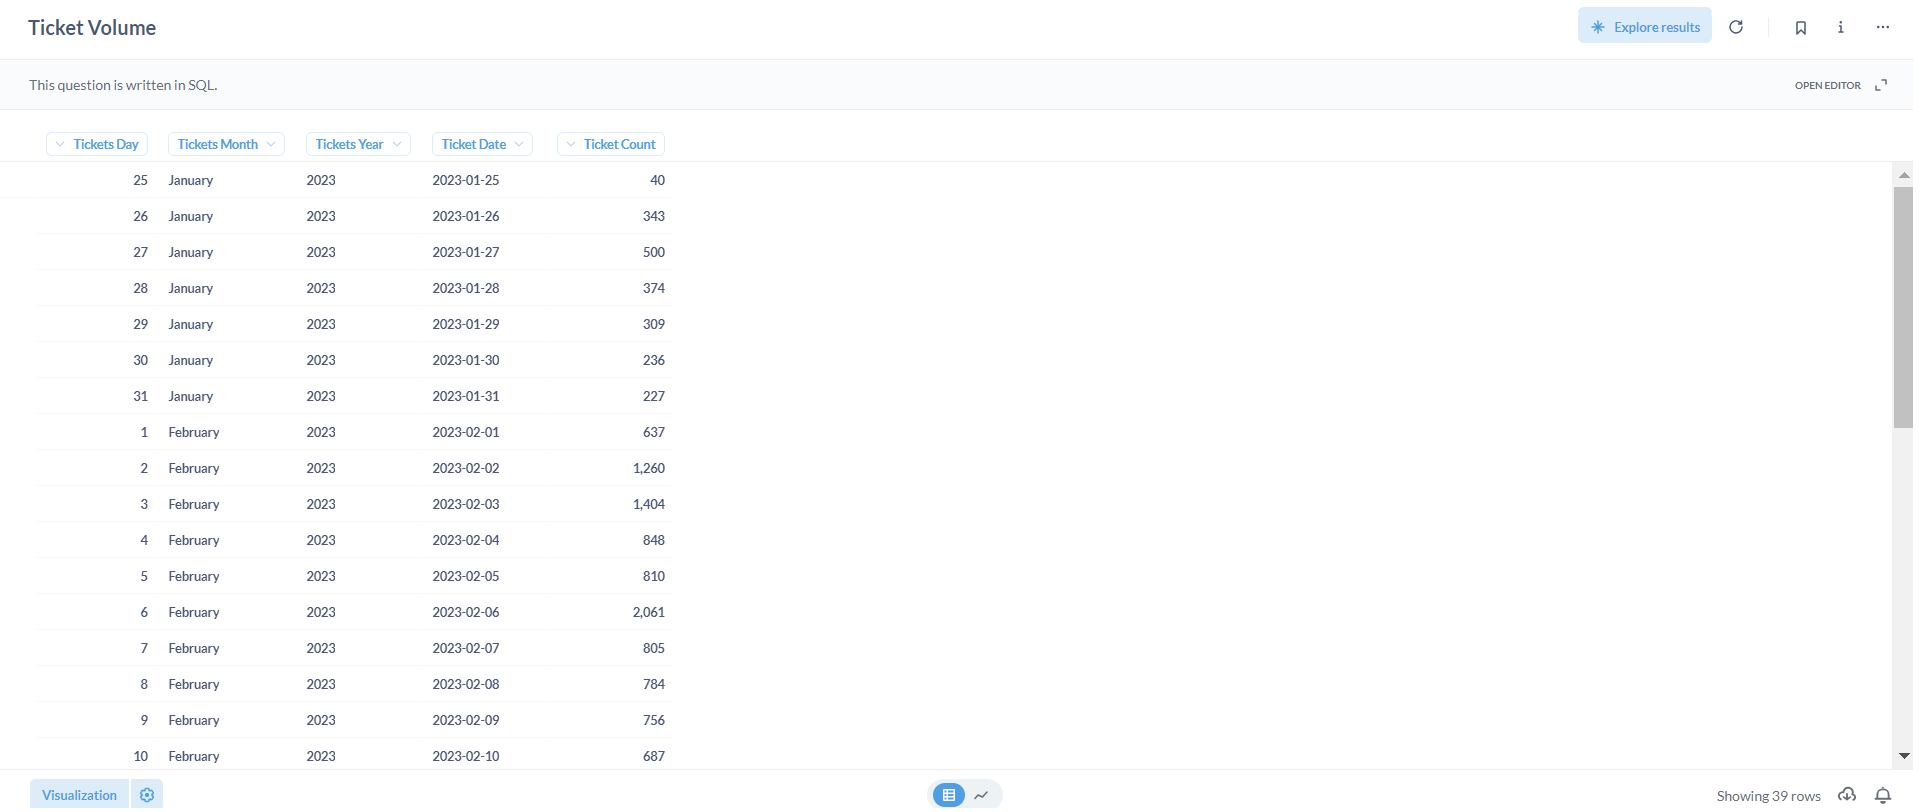
2. Tabular Presentation:
The tabular form with graphical view data, such as the ticket day, ticket month, ticket year, ticket date and ticket volume, is shown in this part.
If necessary, each presentation can be exported in various formats including .csv, .xlsx, .json, and .png by utilizing the Download full results![]() button. This functionality enables users to access and utilize the data in their preferred format for further analysis or documentation purposes.
button. This functionality enables users to access and utilize the data in their preferred format for further analysis or documentation purposes.
Did this article help?