How Can Queue Summary And Call Be Effectively Represented In A Report?
Updated on 05 Dec, 2024Steps to generate an inbound daily report to display queue summary and call be effectively represented report-
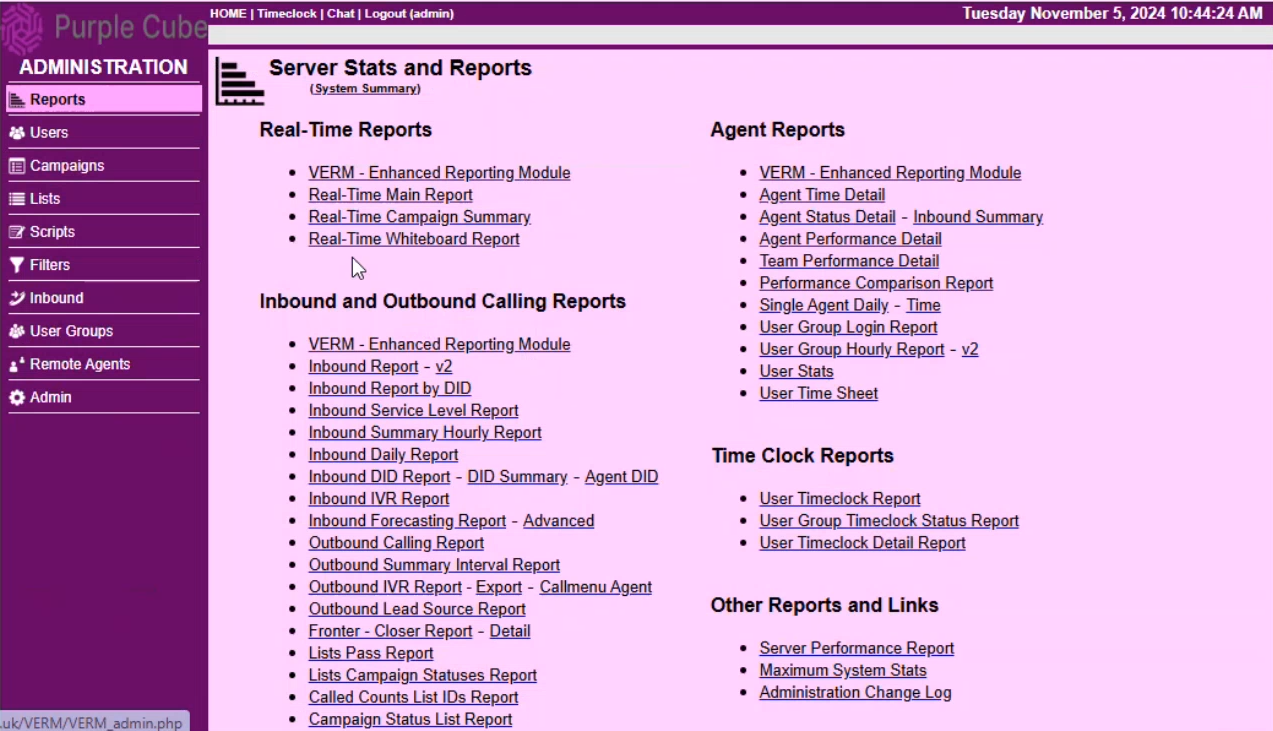
1. Navigate to the Reports menu.
2. Under the Inbound and Outbound Calling Reports section on the Server Stats and Reports page, click Inbound Daily Report.
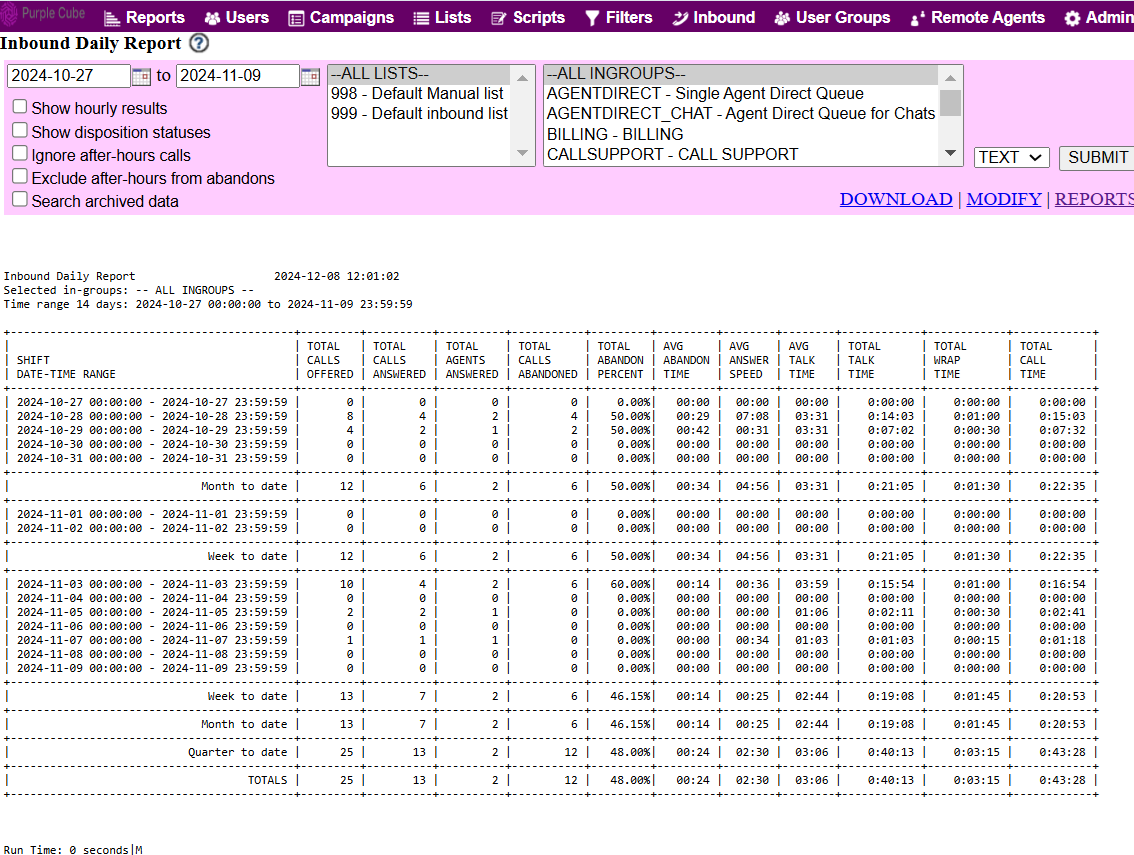
3. Apply the following filters to generate the desired report:
- Date From: Set the shift start date and time.
- Date To: Set the shift end date and time.
- List: Select the list of contacts to be included in the report.
- Inbound Group: Choose the inbound group(s) you wish to analyze (this can be a specific team, campaign, or queue).
4. The report will be generated a table with the following columns:
- Shift Date-Time Range: Date and time range for the selected shift period.
- Total Calls Offered: Total inbound calls that entered the system during the shift.
- Total Calls Answered: Total inbound calls that were successfully answered.
- Total Calls Abandoned: Calls that disconnected before being answered.
- Total Abandoned Percentage: Percentage of calls abandoned relative to total calls offered.
- Average Abandoned Time: Average time callers waited before abandoning the call.
- Average Answer Speed: Average time agents took to answer inbound calls.
- Average Talk Time: Average duration of answered calls.
- Total Talk Time: Total time agents spent on inbound calls during the shift.
- Total Wrap Time: Total time agents spent wrapping up after calls (e.g., notes).
- Total Call Time: Total of talk time + wrap time for all calls.
Did this article help?